Designing a Smarter CLM Experience for Investment Banking

Deloitte’s Front-End MVP for Customer Lifecycle Management.

In my role as UX Lead Consultant, I was engaged by Deloitte to design a modern, front-end MVP that could help global investment banks tackle one of their most deeply embedded operational challenges: fragmented and reactive Client Lifecycle Management (CLM).

A high-fidelity UX prototype was created to unify siloed workflows through modular design, data visualisation, and strategic decision support. Although a Beta was planned for 2020, the project was paused due to COVID-19.

This case study documents the full UX process—from stakeholder discovery to high-fidelity prototype delivery—of a platform built to consolidate onboarding Investment Banking Clients, servicing, compliance, and offboarding into a modular, data-driven interface.

The Challenge

How do you fix a broken lifecycle without replacing the legacy systems that support it?

Global banks operate on layered systems, stitched together over decades. In practice, this meant that:

  • Relationship Managers couldn’t prioritise clients by value or urgency

  • Clients were asked to resubmit the same documents across teams

  • Compliance risk surfaced after deals were already initiated

  • Offboarding was political, manual, and invisible

And perhaps most critically, no one had a single source of truth.

My challenge was to solve all of this—at the experience layer—without disrupting core banking infrastructure.

What This Case Study Covers

UX Lead Consultant, Deloitte (Contract)

How we conducted stakeholder interviews to identify systemic pain points

How I translated hypotheses into a modular UX strategy

How I led design across five critical user flows:

    • Client Prioritisation

    • Single Customer View

    • Add-On Product Requests

    • Compliance Risk Triage

    • Exit Trigger Logic

The UX methods I applied to transform raw insights into actionable design

The final high-fidelity prototype delivered to senior stakeholders at Deloitte and client banks

Personas & Discovery Insights

This platform was shaped directly by interviews with client-facing bankers, compliance officers, operations teams, and banking clients themselves. We conducted workshops and SME interviews to uncover bottlenecks, redundancies, and service risks across the client lifecycle.

From these sessions, three core personas emerged—each reflecting a critical user type whose day-to-day pain points the system was designed to resolve:

Sarah – Relationship Manager (Tier 1 & 2 Clients)

“I need one place to see what’s urgent, who’s falling behind, and what’s missing.”

  • Manages 50–80 clients across products
  • Frustrated by siloed info (email, Excel, SharePoint)
  • Often blind to SLA breaches or dormant clients
  • Spends time chasing compliance/doc teams

Modules Impacting Sarah:

  • RM Dashboard
  • SCV Panel
  • Add-On Product Flow
  • Exit Trigger Tracker

Anika – Compliance Officer (KYC, Risk, AML)

“We’re always reacting—never ahead of risk. And it’s hard to prove who saw what, when.”

  • Reviews risk alerts and audit logs

  • Manages escalations and documentation trails

  • Struggles with versioning and audit readiness

  • Has limited visibility across systems

Modules Impacting Anika:

  • Compliance Risk Panel

  • SCV Panel

  • Exit Trigger Tracker

Daniel – Corporate Client (Product Expansion / Status Updates)

“I don’t always know what’s required—or when it’s been approved.”

  • Represents large corporate clients

  • Engages post-onboarding for product add-ons

  • Wants transparency and reduced admin friction

  • Prefers digital document interaction

Modules Impacting Daniel:

  • Add-On Product Flow

  • SCV Panel

Unearthing the Pain Points That No One System Could Fix

As a cross-functional team, we began with an intensive discovery phase across multiple banking clients. Our focus was on uncovering common breakdowns in client onboarding, compliance, and exit processes.

We conducted:

  • 12+ SME interviews across onboarding, compliance, and RM desks

  • Workshop synthesis using affinity mapping

  • Review of internal Deloitte CLM strategy documents

  • Comparative IA audit of existing portals and servicing tools

What We Learned

We identified six persistent, systemic problems—each causing delays, confusion, or risk exposure. Below, I’ve included direct quotes to show the emotional and operational weight of each issue.

1. No Single Customer View

“I have to ask three different teams just to confirm if KYC is valid.” — Relationship Manager, Top 5 Global Bank

→ Data was fragmented across CRMs, spreadsheets, and email threads.

→ RMs, Compliance, and Ops had different truths.

2. Manual Onboarding & Fragmented Workflows

“Every client becomes their own project manager. We make them chase us.”
— Onboarding Specialist, UK Investment Desk

→ Document duplication, approval silos, and no shared timeline.

3. Risk Surfaces Too Late

“We’re always reacting. By the time we see a red flag, the deal’s halfway through.” — 2LOD Officer, Global Compliance

→ No dashboard or alerts for compliance to triage early.

4. No Tiering or Client Prioritisation

“I don’t know if I’m spending my time on the right clients.” — RM, Commercial Banking

→ No embedded logic for revenue, SLA, or inactivity.

5. Duplicate Document Requests Across Teams

“I submitted this last month—why are you asking again?”
— Mid-Tier Institutional Client

→ Redundancy caused frustration and trust erosion.

6. Offboarding Was Risky, Manual, and Invisible3. Risk Surfaces Too Late

“It takes three months and four approvals just to close an inactive account.” — Ops Lead, Exit Process Review

→ No shared rules engine, risk scoring, or audit log visibility.

Framing the Design Opportunity

From these pain points, I worked with our team to develop a problem–hypothesis map, framing how each insight could be solved via interface-level innovation.
We agreed on a modular, front-end approach to reduce integration risk while delivering value quickly.
Our goal was not to reinvent core systems. It was to surface the right information at the right time, for the right user—visually, clearly, and in a way that drove action.

From Hypotheses to High-Fidelity

My Design Approach

From the six systemic pain points we identified during discovery, I translated each into a clear hypothesis and a targeted UX feature module.

My goal wasn’t to build another portal. It was to give each role in the CLM ecosystem the one thing they needed most, right when they needed it—through visual clarity, action-first hierarchy, and intuitive IA.

Working closely with Deloitte’s CLM strategy team and our technical stakeholders, I proposed five MVP modules. Each module corresponds to a specific lifecycle phase—and maps directly back to validated user needs.

MODULE 1 – RM DASHBOARD

Helping Relationship Managers Focus on What (and Who) Matters Most

Data Visualisation Logic

The dashboard applies lightweight data visualisation principles to reduce cognitive load:

Visual ElementPurpose
Tier CardsQuantify client distribution and alert concentration
Alert ChipsEncode risk state without needing detailed rows
Table SortingEnable dynamic data prioritisation on SLA or Tier
TooltipsReveal hidden escalation logic without overwhelming UI

This approach blends data clarity with interaction efficiency—allowing fast orientation without traditional charts.

Framing the Problem

One of the most frequent challenges raised during stakeholder interviews was this:

“I don’t know if I’m spending my time on the right clients.” — Relationship Manager, Tier 1 Desk

Relationship Managers (RMs) were working with up to 80 clients at once, yet had no system that clearly indicated:

  • Who was high-value or high-priority

  • Where service-level agreements (SLAs) were at risk

  • Which clients had outstanding documentation or activity red flags

Instead, they relied on spreadsheets, emails, and disconnected CRM entries. No alerts, no triage, and no actionable hierarchy.

UX Hypothesis

If we surface Tier, SLA, activity status, and recommended actions in a single dashboard view, then RMs can prioritise their client base in real time—without waiting for email alerts or Excel updates.

This hypothesis guided the structure of what became the RM Dashboard: a tactical control centre for RMs, built with fast visual scanning, colour-coded logic, and modular flexibility.

UX Design Principles Applied

    • Hick’s Law: Limit decision fatigue by surfacing only key actions per client row

    • Progressive Disclosure: Show escalation flags and tier at a glance; full notes on hover

    • Fitts’s Law: Large, easily clickable CTAs (“Upload Docs”, “Escalate”)

    • Information Scent: Colour-coded badges (Tier), chips (SLA/Dormant/Risk) guide scanning

    • User Control & Feedback: Sorting, filtering, and hover previews aid confidence

    • Accessibility (WCAG 2.1 AA): Colour + icon logic ensures visibility under all conditions

    • Atomic Design: Cards, chips, buttons, rows, and tags are reused across modules

Ideation & Low-Fidelity Prototyping

Lo-Fi Version
    • Stacked Tier Cards above a master client table

    • Row-by-row logic with columns: Client, Tier, Status, Next Action, Last Interaction

    • Inline chips showed SLA status, Dormant flags, and Document requests

    • Sorting toggles on Tier and SLA columns

    • “Next Action” logic pre-populated (e.g. Escalate, Upload, Exit)

MVP Testing & Feature Prioritisation

Must-Have Features for MVP:
  1. Tier Cards: Glanceable view of Tier 1–3 volumes + alert count

  2. Table Layout: Scannable, sortable, hover-enhanced

  3. Alert Chips: Immediate visual of risk and SLA status

  4. “Next Action” Column: Removes ambiguity and adds accountability

Persona Served

Sarah (RM) now logs into her dashboard and sees:

A clear breakdown of client volume by tier

Alerted clients surfaced by risk state

A precise next action per client row

Full interaction history and task ownership

“Instead of managing from memory, I can now manage by design.”

MODULE 2 – Single Customer View

A Unified, Role-Aware Interface for Document Status, Risk, and Client Timeline

Data Visualisation Logic

The KYC Heatstrip and tag-driven tables exemplify lightweight, embedded data visualisation:

ElementPurpose
KYC HeatstripSingle-row, colour-coded visual of document status distribution
Status Tags (Table)Repeat logic (icons + text) improves scannability and clarity
Timeline PanelVisual clustering of events without heavy charting
Inline CTAsShow only one required action per doc = reduce decision fatigue

This is not chart-heavy, but decision-lightweight—designed for speed, accuracy, and clarity across teams.

Framing the Problem

Throughout our workshops and stakeholder interviews, a common friction point emerged:

“We don’t have a single place to see where the client is in the process.” — KYC Officer, Global Onboarding Team

Each team (RMs, Compliance, Ops) had access to partial information across siloed systems—email chains, PDFs in SharePoint, CRM notes, and Excel trackers. This caused:

  • Duplicate document requests to clients

  • Delays in onboarding or product fulfilment

  • Lack of clarity around compliance state and history

Worse, no one owned the “single view.” It was everyone’s problem—and no one’s responsibility.

UX Hypothesis

If we deliver a modular, tabbed Single Customer View (SCV) combining KYC status, risk alerts, document audit logs, and a shared timeline, then teams can align faster and reduce handover delays.

The solution had to support visual triage, role-based priorities, and fast action—without overwhelming any single user.

UX Design Principles Applied

  • Recognition Over Recall: Status is visually encoded with colours and icons
  • Progressive Disclosure: Action logs and document rows expand only when needed
  • Law of Proximity: Document fields grouped logically (e.g., KYC section)
  • Jakob’s Law: Familiar layout—tabs, tables, and forms used where expected
  • Consistency & Standards: Status chips, CTA buttons reused from RM Dashboard
  • Accessibility: Colour-coded + textual status for every field
  • Modular IA: Each tab represents a reusable, standalone content block

Ideation & Low-Fidelity Prototyping

  • Tabs: KYC | Timeline | Risk | Uploads
  • KYC Heatstrip across top: visual map of missing/expiring/completed items
  • Inline CTAs per row: “View”, “Upload”, “Update”
  • Audit Log Panel: collapsible section showing timestamped notes

MVP Testing & Feature Prioritisation

  • KYC Heatstrip (visually encodes status across all documents)

  • Tabbed navigation (clear cognitive grouping by task)

  • Inline action buttons (upload, update, view—based on role and status)

  • Audit log with compliance notes (transparent action trail)

Persona Served

Sarah (RM): Views status at a glance, adds RM notes, flags missing docs

Anika (Compliance): Logs escalations, reviews doc history

Daniel (Client): Benefits passively—fewer document chases, faster service

MODULE 3 – Add-On Product Flow

Enabling Product Expansion with Minimal Friction and Maximum Clarity

Data Visualisation Logic

This module uses interaction-as-visualisation rather than charts. Key elements include:

ElementPurpose
Upload checklistVisualise progress and gaps in real time
Upload status tags“Missing”, “Invalid”, “Uploaded” – visual alert system
Timeline labelReview time shown to manage expectations
Status updatesLast Updated per doc = temporal tracking and accountability

It’s a data-driven flow, not a chart-driven one—supporting clarity, validation, and fast internal handover.

Framing the Problem

A major pain point uncovered in both RM and Ops team interviews was the chaos of post-onboarding product requests.

Each time a client wants something new, it’s like onboarding them all over again.” — Ops Lead, Corporate Banking

Once a client was live, adding new products (FX, lending, custody, etc.) triggered:

  • Confusion over eligibility

  • Manual back-and-forth on required documentation

  • No clarity on who reviews what and when

Existing processes were opaque, inconsistent, and relied on Outlook, Word forms, and PDF uploads. Clients had no visibility. Internal teams had no workflow logic.

UX Hypothesis

If we provide a guided, step-by-step Add-On Product flow with eligibility filtering, document checklisting, upload logic, and submission review, we can reduce time-to-approval and internal ambiguity.

The flow had to be simple for RMs like Sarah, accountable for completeness, and easy for Compliance to validate.

UX Design Principles Applied

  • Guided Interaction Design – Step-by-step form with progressive unlock
  • Principle of Least Effort – Auto-filtered product list and inline validation
  • Error Prevention (Nielsen) – Upload warnings, required field checks, file type gates
  • User Control – Upload, replace, cancel actions embedded directly
  • Status Visibility – “Last Updated” fields, in-progress states, tooltips
  • Atomic Design – Form fields, document tags, and CTAs reused across SCV and Risk modules
  •  

Ideation & Low-Fidelity Prototyping

  • Left panel with product request summary

  • Right panel with dynamic checklist: Mandatory, Conditional, Optional

  • Inline document action states (View, Upload, Replace)

  • Error and upload-state indicators

  • Final review screen with “Estimated Review Time” and submission context

MVP Testing & Feature Prioritisation

    • Eligibility-filtered product selector

    • Smart document checklist (dynamic by product and client)

    • Upload state logic: Mandatory/Optional/Conditional

    • Upload and replace interaction with instant feedback

    • Submission screen with timeline and handoff info

Persona Served

Daniel (Client): Indirectly benefits—fewer doc chases and resubmissions

Sarah (RM): Initiates product request, uploads docs, tracks progress

Anika (Compliance): Receives clean, pre-filtered package with audit trail

MODULE 4 – Compliance Risk Panel

Proactively Flagging Risk with a Unified Escalation and Audit Interface

Data Visualisation Logic

While not using traditional charts, this module leverages lightweight data storytelling through:

ElementPurpose
Summary CardsVisual distribution of active risk, breaches, and queue size
Table with colour-coded flagsPrioritise by alert severity and ownership
Date + trend indicatorsWeek-on-week signal embedded in risk cards
Audit TrailVisual evolution of risk lifecycle, actor engagement over time

This interface balances control panel utility with visual cognitive cues to drive decisions.

Framing the Problem

In our discovery sessions with Compliance Officers and Risk Analysts, a single challenge echoed repeatedly:

By the time we see the issue, the breach has already happened.” — Senior Compliance SME, CIB Oversight

The compliance team had no central place to:

  • Monitor high-risk client flags across Tier levels

  • Escalate KYC issues, SLA breaches, or anomalous inactivity

  • Track decision logs or see how risk has evolved over time

Instead, each incident was discovered through email alerts, offline trackers, or ad hoc queries. This lack of visibility delayed escalations and left the bank exposed.

UX Hypothesis

If we provide a central risk triage panel that combines flagged client alerts, risk levels, and a compliance audit trail, we can empower Compliance teams to respond earlier, faster, and with full documentation.

This would replace scattered spreadsheets and inbox searches with a shared, real-time control panel.

UX Design Principles Applied

  • Law of Prägnanz – Card layout groups alert types visually

  • Fitt’s Law – “Escalate” and “Update” are placed inline for immediate action

  • Hick’s Law – Risk table filters and categories limit overload

  • Recognition Over Recall – Clients grouped by risk severity (colour-coded + labels)

  • Feedback & Visibility – Audit log shows timestamps, escalation path, and user decisions

  • Consistency – Chips, buttons, tables reused from previous modules (Dashboard, SCV)

Ideation & Low-Fidelity Prototyping

    • Summary cards: High, Medium, Low Risk + SLA Breaches + Awaiting Review

    • Filterable table of client alerts: Name, Alert Type, Priority, Owner, Last Updated

    • Inline CTAs: “Escalate” and “Update” tied to role and alert type

    • Scrollable audit trail with actor history (e.g. “Sarah escalated on 11/10/19”)

MVP Testing & Feature Prioritisation

  • Summary Cards by Risk Category (driven by backend logic)
  • Risk Queue Table with filters by client, tier, risk, owner
  • Actionable CTA buttons inline: View, Update, Escalate
  • Audit Trail with date, actor, action breakdown

Persona Served

Anika (Compliance Officer): Central risk triage, action triggering, and review log

Sarah (RM): Can follow up on flagged clients, understand why escalations occurred

Ops Manager: Uses card metrics to manage team load and triage efficiency

MODULE 5 – Exit Trigger Tracker

Proactive Offboarding Through Visual Risk-Inactivity Correlation

Data Visualisation Logic

This module is built around a central scatterplot as the primary decision-support element:

Visual ElementFunction
Chart (Risk vs Inactivity)Correlate latent inactivity with risk urgency
Colour-coded DotsRed = Risky + Dormant, Yellow = Dormant, Green = Active
Hover/Click LabelsExpose client name, last login, Tier, £ value
Trend FiltersSegment by Tier or Dormancy for focused action
Audit TrailVisual memory of escalation chain

This was the most “data-dense” module—yet remained intuitive thanks to careful layout, filtering, and progressive interaction design.

Framing the Problem

A striking gap identified in both Compliance and Strategy workshops was the lack of an exit framework:

We invest heavily in onboarding clients—but have no systematic way to exit them.” — Senior Partner, Deloitte CLM Advisory

Clients that were inactive, unprofitable, or flagged for repeated risk violations stayed on the books indefinitely. This led to:

  • Resource drain on RMs and operations

  • Exposure to regulatory scrutiny due to inactive high-risk clients

  • Missed opportunities to proactively flag and formalise exits

There was no logic—just legacy.

UX Hypothesis

If we provide a visual interface showing clients by inactivity and risk score, backed by a filterable trigger panel and decision log, then RMs and Compliance can jointly manage proactive offboarding.

We aimed to build a shared, visual risk exit framework—something no Excel sheet could replicate.

UX Design Principles Applied

  • Law of Common Region – Chart clusters indicate urgency and trigger logic
  • Recognition over Recall – Risk + activity encoded in dots and filters
  • Feedback Loops – Decision log records who acted and why
  • Progressive Disclosure – Detail shown on selection or hover, not default
  • Error Prevention – No exit action without note confirmation
  • Accessibility – Colour + icon layering on scatter chart; tag legends readable

Ideation & Low-Fidelity Prototyping

  • X-axis: Days since last activity
  • Y-axis: Risk Score (0–100)
  • Filters: Tier, Dormancy Flags, Revenue, SLA Violations
  • Chart points clickable, linked to audit panel
  • Below: Action Log = Manual/Auto Flags, Escalations, Notes

MVP Testing & Feature Prioritisation

  • Interactive scatter chart (Risk vs Inactivity)
  • Filters to isolate Tier 1, Dormant, or SLA-violating clients
  • Audit panel with decision log and escalation notes
  • Modal actions: “Flag for Exit”, “Escalate”, “Reactivate”

Persona Served

Anika (Compliance Officer): Central risk triage, action triggering, and review log

Sarah (RM): Can follow up on flagged clients, understand why escalations occurred

Ops Manager: Uses card metrics to manage team load and triage efficiency

Executive Summary

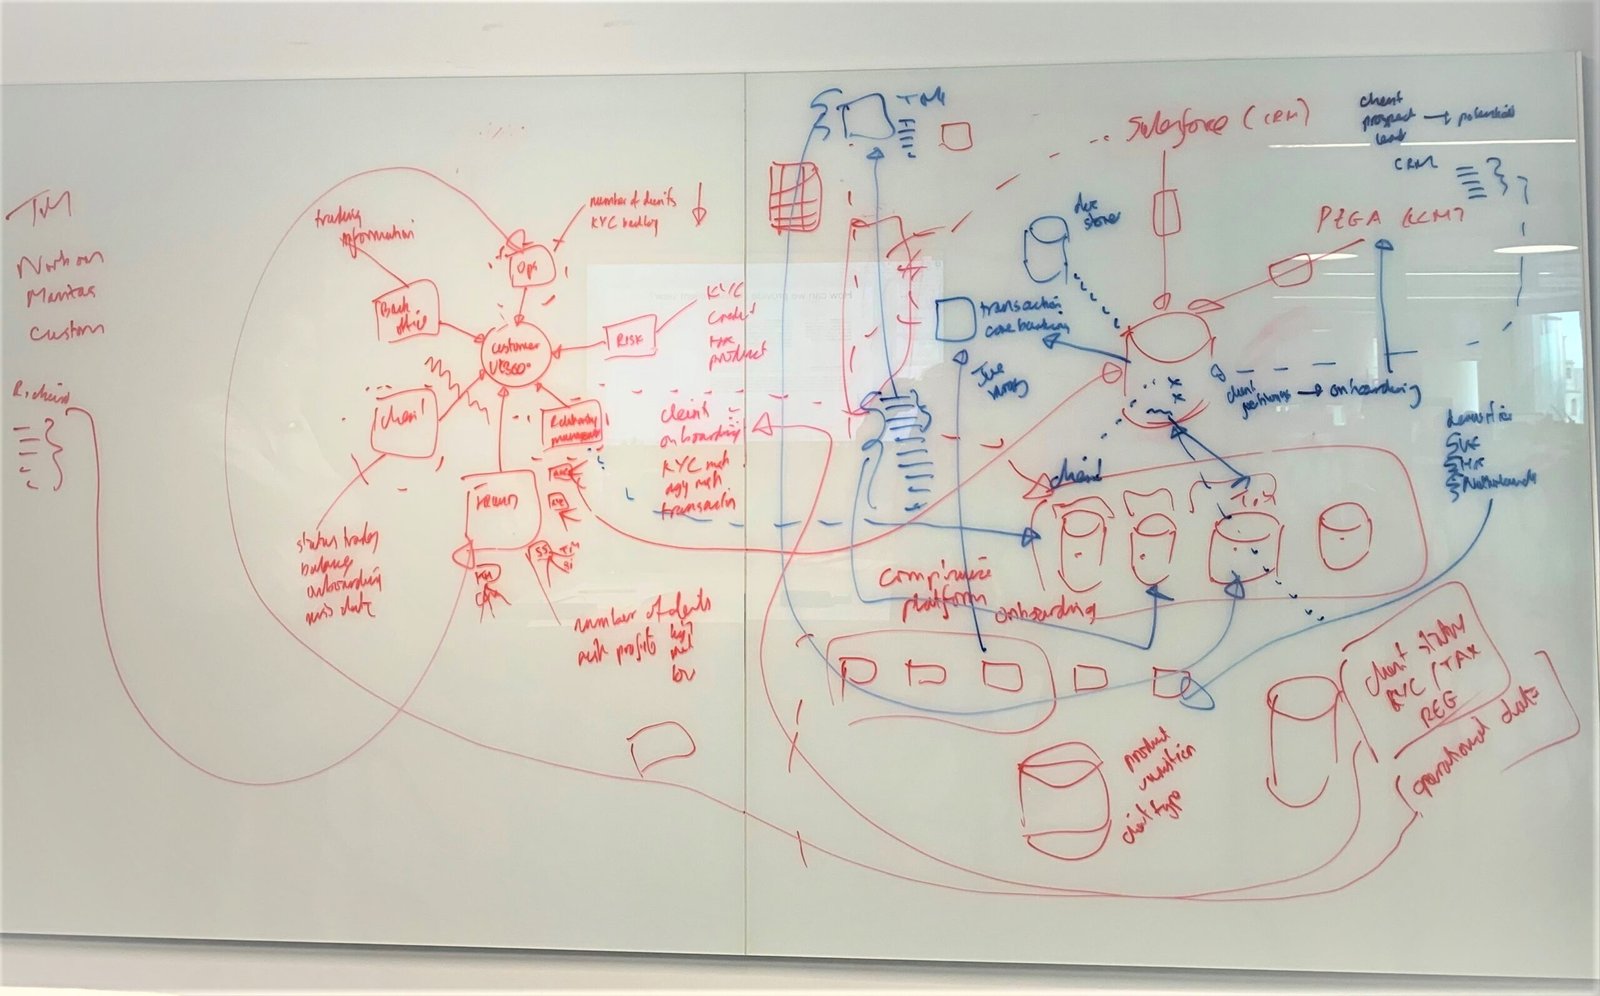
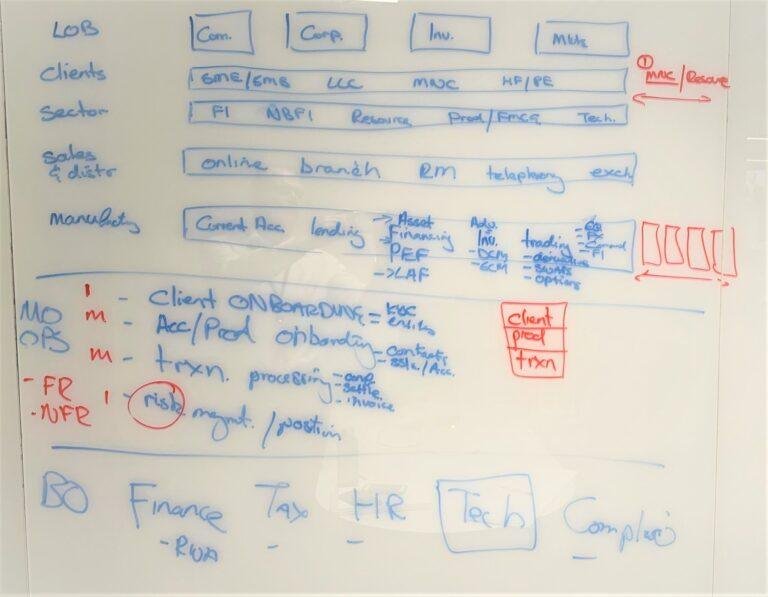
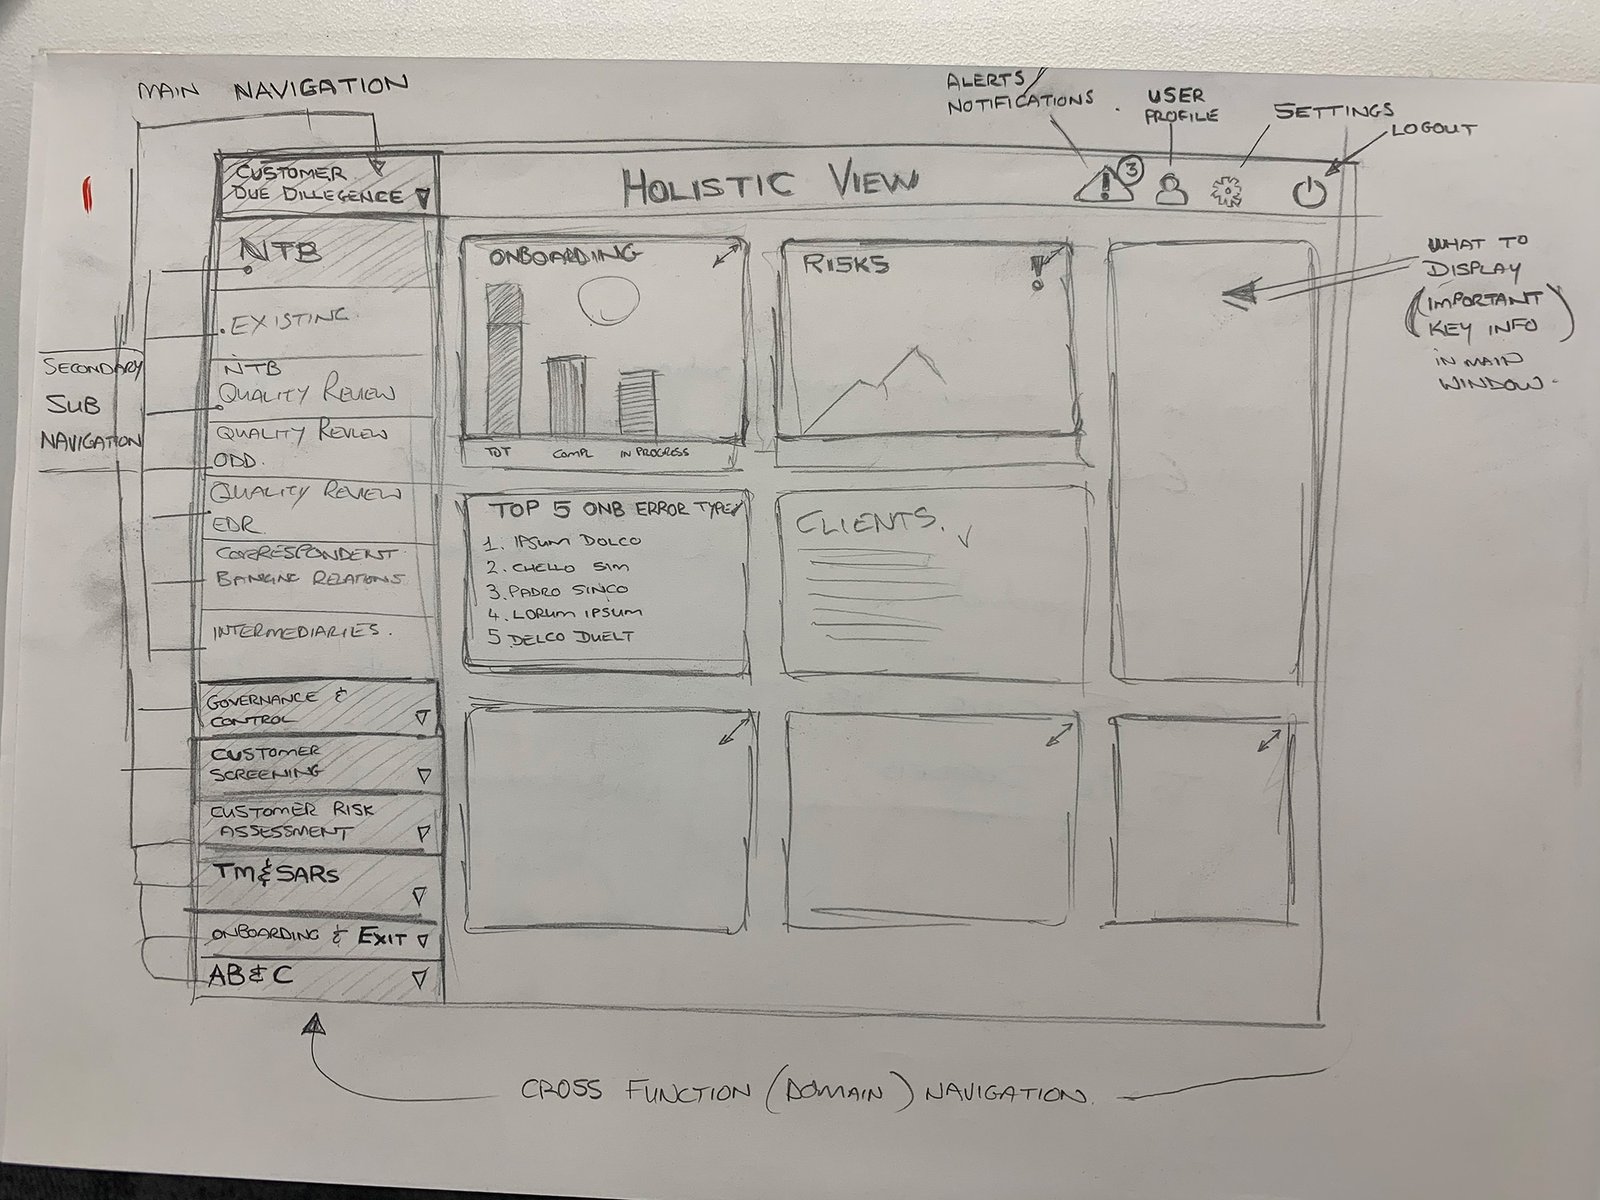
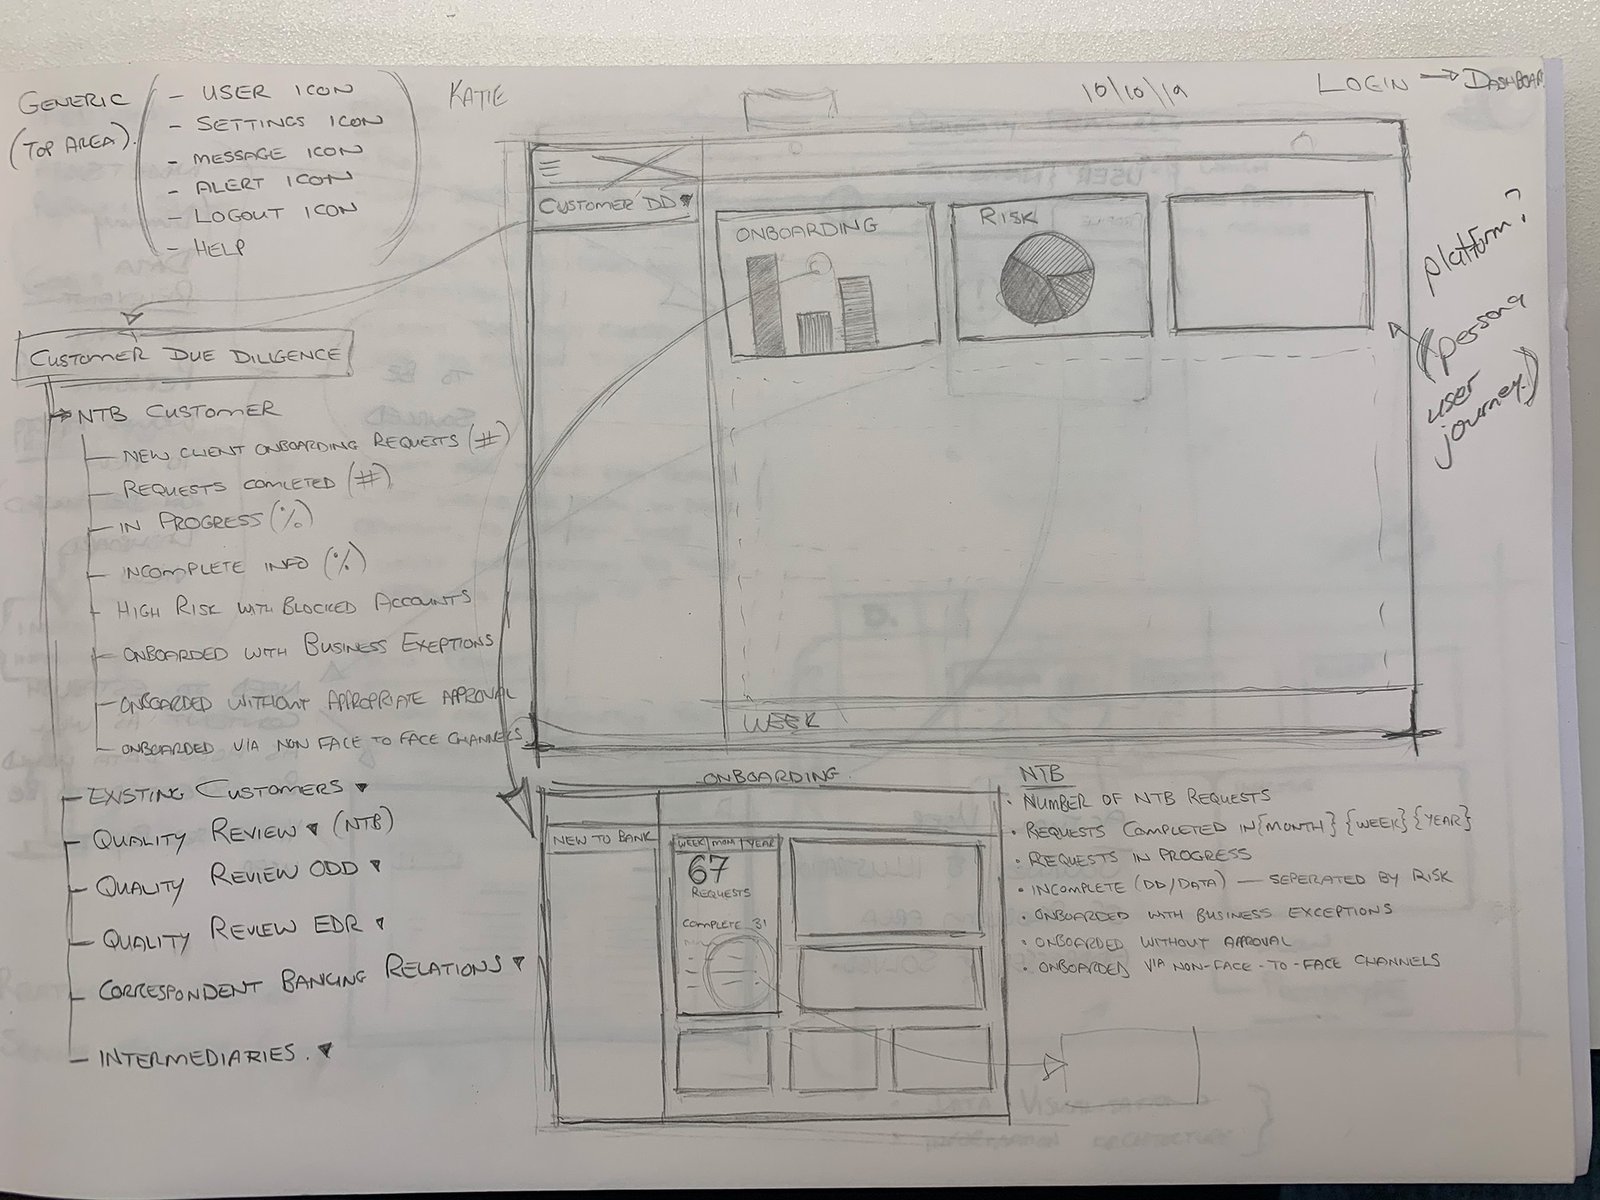
In 2019, I was brought into Deloitte’s Digital Forensics team to lead UX design on a strategic Customer Lifecycle Management (CLM) prototype for investment banking clients. The goal was to replace fragmented onboarding, compliance, and servicing processes with a unified, data-driven experience layer.

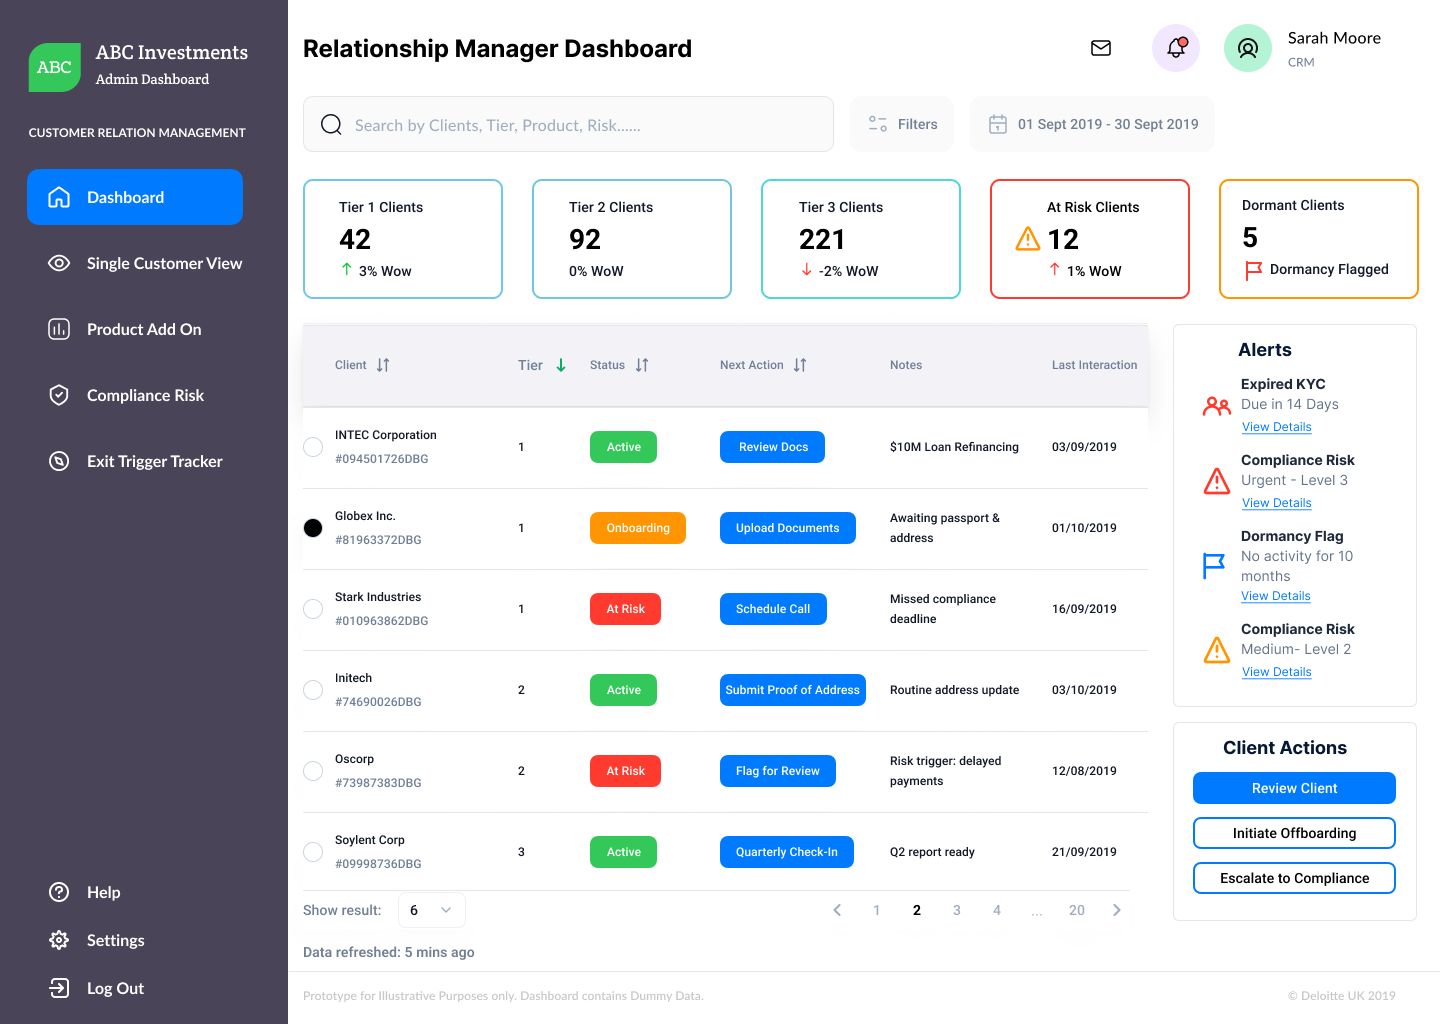
I designed five interconnected modules:

  • RM Dashboard – Client prioritisation by tier, SLA, and risk

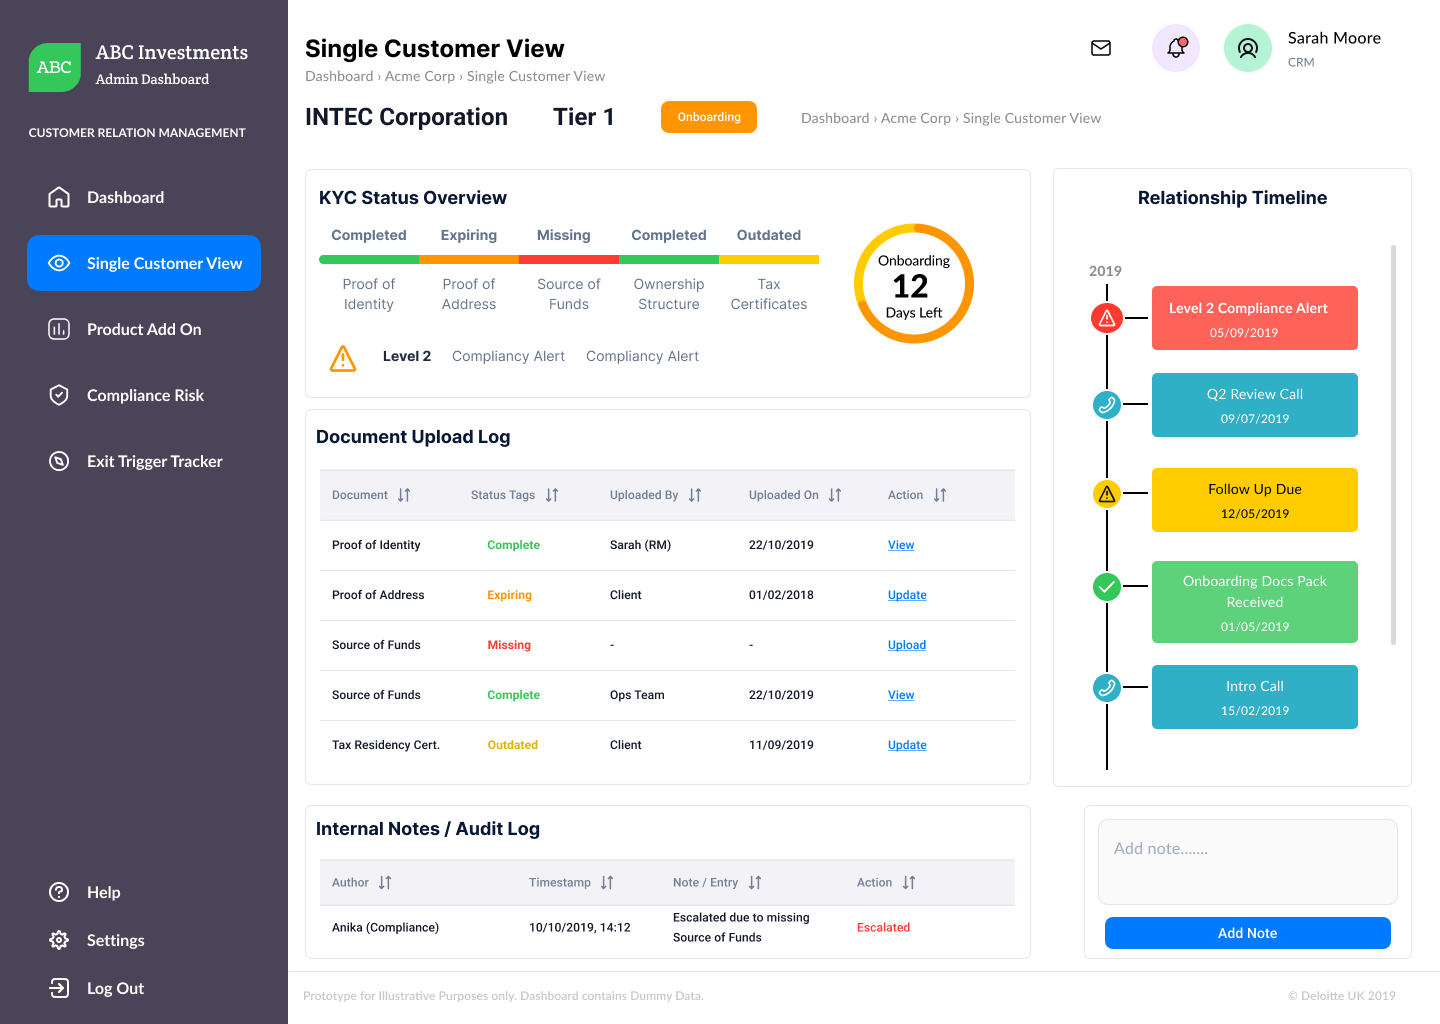
  • Single Customer View – Tabbed hub for KYC, risk, and document status

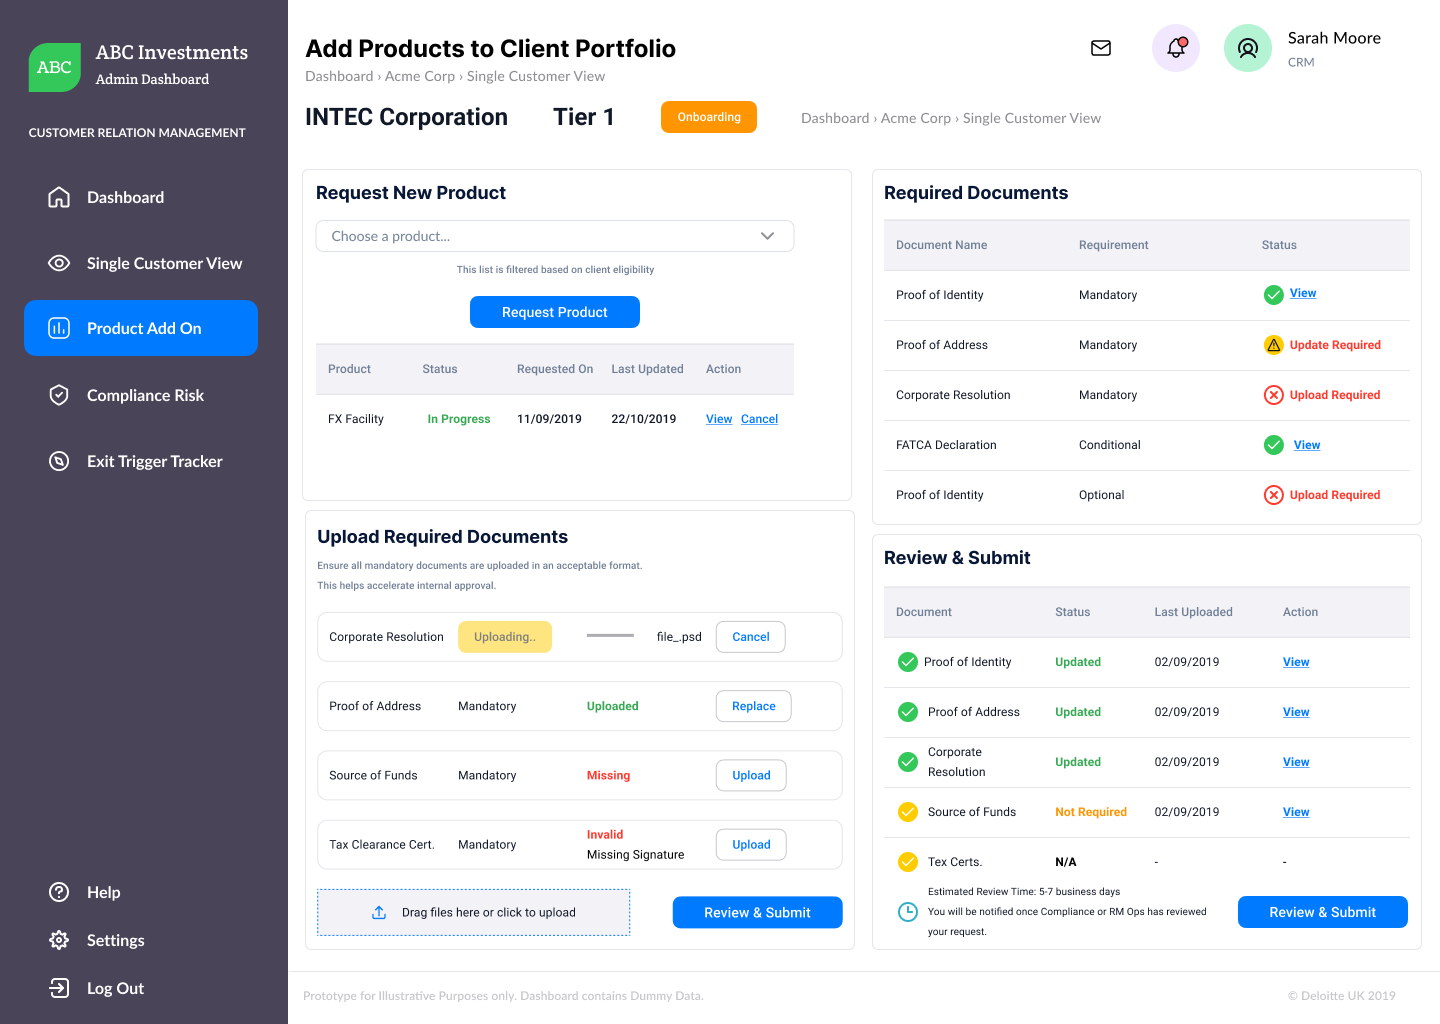
  • Add-On Product Flow – Guided checklist and submission logic

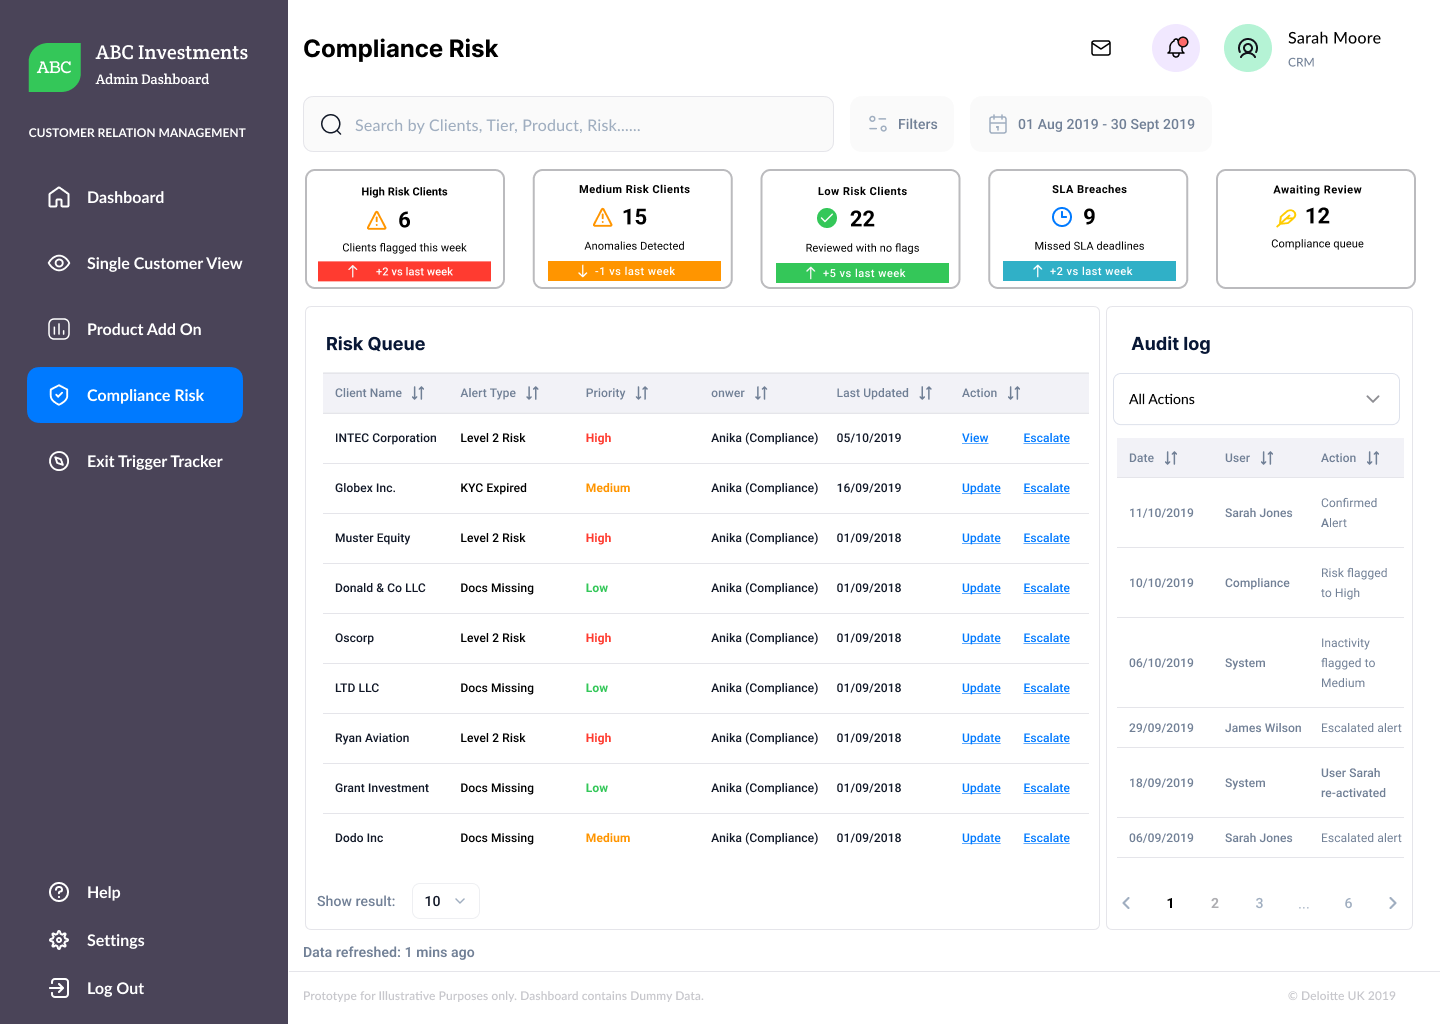
  • Compliance Risk Panel – Escalation dashboard and audit trail

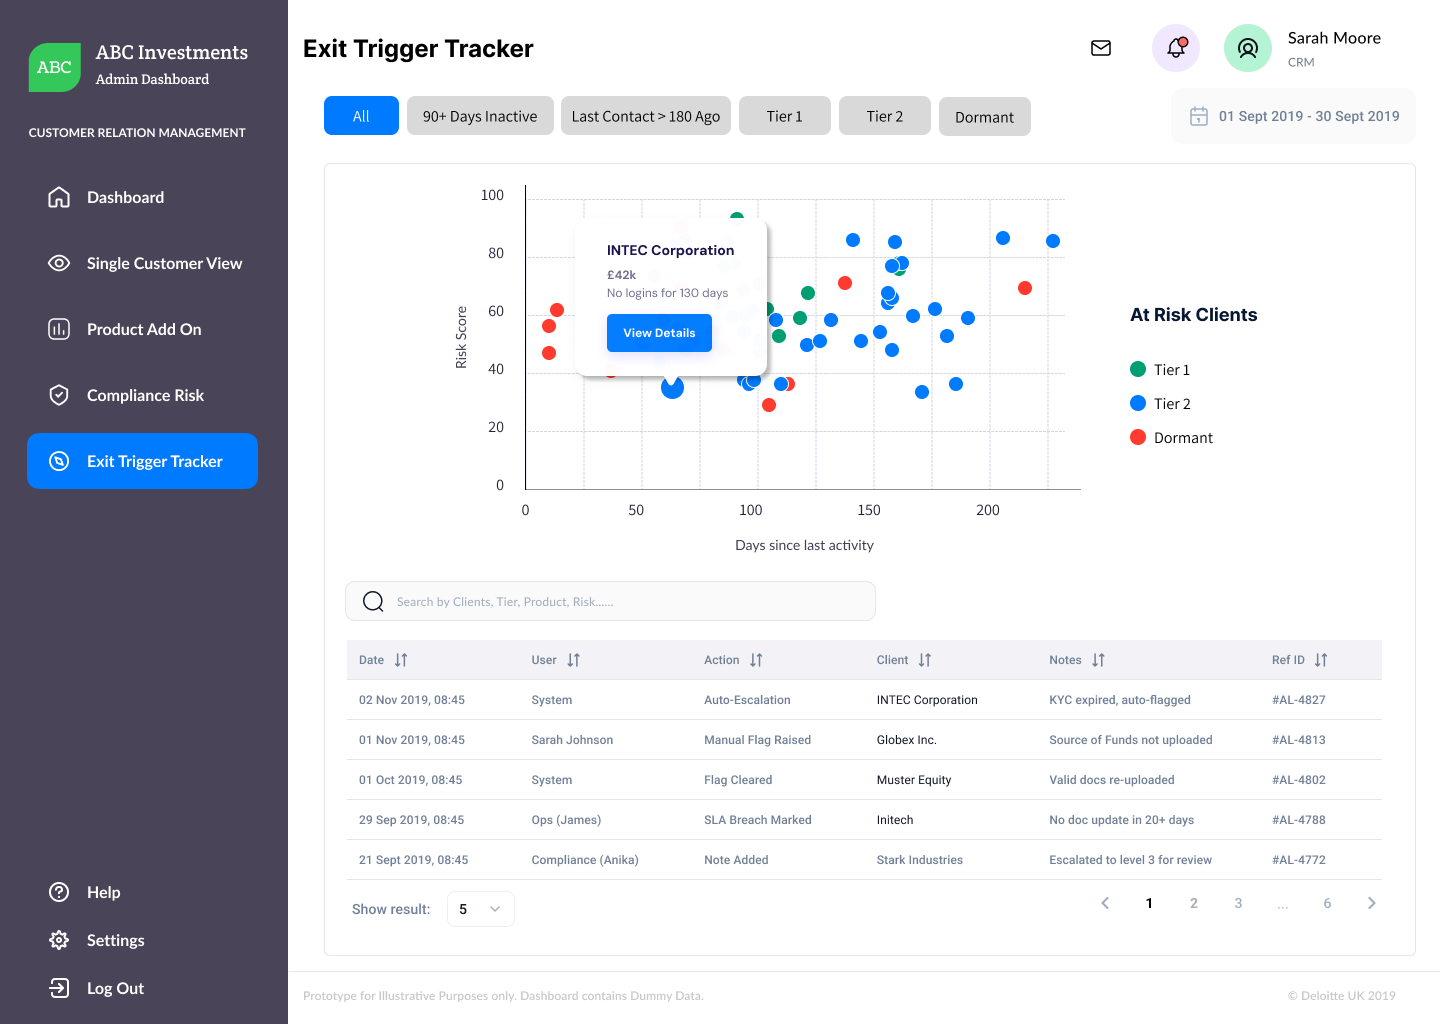
  • Exit Trigger Tracker – Inactivity vs risk scatterplot to support proactive offboarding

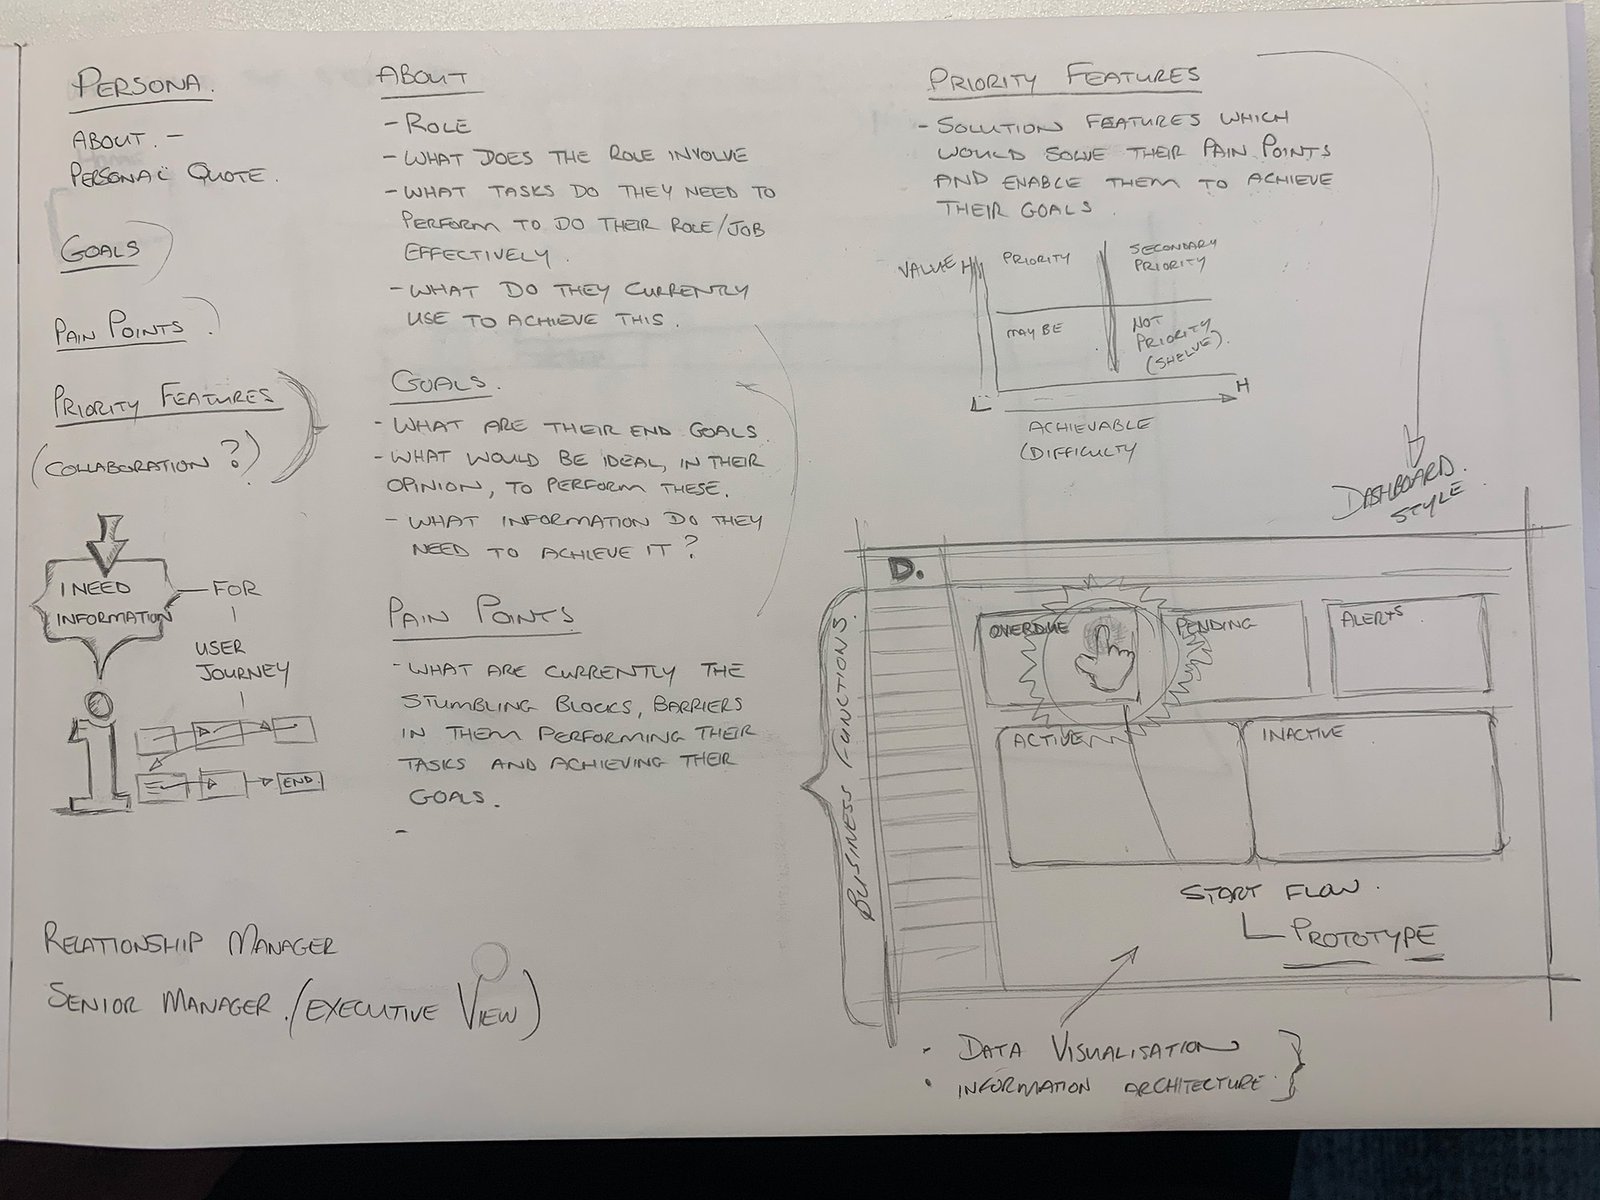
We ran workshops, mapped user flows, prioritised MVP features, and delivered a fully validated high-fidelity prototype—grounded in accessibility, atomic design, and real-time data visualisation.

Although well received, development was paused due to:

  • High initial implementation costs

  • Risk of disrupting live banking systems

  • Incompatibility with some legacy infrastructure

A Beta phase was planned for early 2020 to test functionality with engineers and IT architects. I was scheduled to return to develop the design system and lead UX handover. However, the COVID-19 crisis triggered financial reprioritisation across banks and Deloitte, halting the programme before development began.

This remains a strong example of how UX can drive strategic clarity, visual governance, and data-backed decision-making in complex enterprise environments.