CASE STUDY OVERVIEW

Publicis Sapient | Nissan

Car Configurator V2

Finance Journey Prototype Case Study

Listen to the Case Study Overview:

Discover how Nissan’s car configurator was reimagined to drive engagement, streamline choice, and boost conversion across a fragmented digital journey. This brief audio overview reveals the UX strategy that turned complexity into clarity for thousands of daily users.

Listen to explore the challenge, the thinking, and the measurable uplift in performance..


The Nissan Configurator Story

From Vision to Reality: Addressing Key Digital Challenges

Nissan’s online Car Configurator underwent a prototype redesign in Figma to address significant usability challenges and enhance the finance selection experience.

The original “all-in-one” single-page layout combined model, colour, accessory, service and finance options on one scrollable canvas.

Although technical performance was sound, users often failed to discover the buried finance calculator and returning visitors could not retrieve previously selected finance plans.

These issues resulted in high drop-off rates (31 % before finance; 12 % mid-flow on revisit) and hundreds of support tickets each month. In comparison, Mazda’s multi-step configurator consistently retained context and achieved higher completion rates.

The prototype redesign introduced a step-by-step flow and a persistent session-memory finance widget. This case study outlines the research, design, validation and projected business impact, including a model for forecasting live-site improvements.

The Challenge:

A Labyrinth of Complexity

The existing Nissan Car Configurator presented critical usability challenges that hindered user engagement and completion rates, contributing to a competitive gap with brands like Mazda. A deeper dive revealed core issues leading to significant user frustration.

Configurator User Experience Metrics

Initial audits revealed critical user experience scores on a 0-10 scale.

Engagement: 1.6/10 (extremely low interest).

Frustration: 3.3/10 (significant annoyance). This data highlighted a critical failure to meet user expectations.

Load Speed Performance

Slow load times directly impact initial impressions and user retention, putting Nissan at a disadvantage.

Nissan’s configurator loaded in a sluggish 5.6 seconds, considerably slower than Mazda’s 4.2 seconds, underscoring a key performance bottleneck.

Understanding the User: Empathy Map

To truly redesign, we first needed to gain a deep understanding of "The Aspiring Car Owner" and their experience within the existing configurator. This empathy map visualises their perspective.

HEAR

  • “Car buying is so complicated, especially the finance part.”
  • “I heard Nissan’s online experience can be a bit clunky.”
  • “Mazda’s configurator is really easy to use.”
  • “Watch out for hidden costs when buying a car.”
  • “You need to understand PCP vs. HP before you commit.”

SAY & DO

  • “Where’s the finance part?”
  • “This is too much information, I’m just going to look at models.”
  • “What does ‘balloon payment’ mean?”
  • Scrolling extensively up and down the page.
  • Opening new tabs to search for finance explanations.
  • Abandoning the configurator before completion.
  • Contacting customer support for clarification.

SEE

  • A single, long page with many options.
  • Overwhelming amount of information at once.
  • A finance calculator that is hard to find or understand.
  • Complex jargon without clear explanations.
  • Unclear progress indicators or steps.
  • Potential technical glitches (e.g., JavaScript

THINK & FEEL

  • “This is confusing/overwhelming.”
  • “Am I missing something important?”
  • “I hope I’m making the right financial choice.”
  • “This feels complicated, I wish it was simpler.”
  • “Frustrated by the lack of clarity.”
  • “Uncertain about the total cost.”
  • “Worried about hidden terms.”
  • “Exhausted by the endless scrolling.”

PAIN

  • “This is confusing/overwhelming.”
  • “Am I missing something important?”
  • “I hope I’m making the right financial choice.”
  • “This feels complicated, I wish it was simpler.”
  • “Frustrated by the lack of clarity.”
  • “Uncertain about the total cost.”
  • “Worried about hidden terms.”
  • “Exhausted by the endless scrolling.”

GAIN

  • Clarity & Simplicity: An easy-to-understand, step-by-step process.
  • Financial Confidence: Clear explanations of all finance options and terms.
  • Real-time Cost Updates: See how choices impact the price instantly.
  • Efficiency: A quick and smooth journey to a final configuration.
  • Empowerment: Feeling fully informed and in control of their decisions.
  • Trust: Building confidence in the brand through transparency.

Research & Analysis

Qualitative Insights: Beyond the Numbers

Cognitive Overload

Overwhelming information on a single page, leading to mental fatigue and decision paralysis for users.

Opaque Finance

Hidden calculators, confusing jargon (PCP, HP), and a lack of clear comparisons led to distrust and many support inquiries

Disrupted User Flow

Absence of clear step-by-step guidance left users feeling lost, hindering completion rates and encouraging early abandonment.

Technical Roadblocks

Pervasive glitches and thousands of logged JavaScript errors directly contributed to a broken and frustrating user experience.

Design Solution

Our Figma prototype represents a paradigm shift for Nissan’s Car Configurator, transforming a daunting task into an enjoyable and informed journey. By meticulously applying UX best practices, we’ve delivered a solution that excels in clarity, usability, and, most importantly, financial transparency.

Intuitive Step-by-Step Flow

Replaced the overwhelming single-page layout with a structured, multi-step navigation system.

  1. Model Selection

  2. Exterior Colour & Wheels

  3. Interior Trim & Accessories

  4. Optional Packages & Service Plans

  5. Finance Selection (with calculator)

  6. Review & Summary

  7. Confirmation / Apply

Each stage loaded as its own page or panel, rather than presenting everything on one scroll. Navigation controls allowed users to move forward or back without losing prior selections.

This applies progressive disclosure, presenting complex car options (exterior, interior, packs) in digestible segments. Users build their car piece-by-piece, enhancing engagement and boosting completion rates.

Empowering Finance Transparency

This is a core improvement, demonstrating best-in-class financial UX:

  • Always Visible & Selectable Options: All finance options (PCP, HP, Cash) are prominently displayed within a dedicated section, removing ambiguity.
  • Dynamic Switching: A one-click dropdown allows seamless selection of finance types (e.g., specific PCP terms or switching to HP), with all pricing updating dynamically and instantly.
  • On-Demand Explanations (Modals & Tooltips):
    • Modal Pages: Comprehensive modal pages are always a click away for each option, offering detailed, plain-language explanations, benefit/drawback comparisons, illustrative examples, and a key term glossary.
      • Contextual Tooltips: Appear on hover over specific terms (e.g., “Balloon Payment,” “APR”) for instant, concise definitions.

This proactive provision of information builds significant user trust and drastically reduces finance-related support inquiries.

Enhanced Visual Clarity

A clean, modern aesthetic where visual design serves content organisation and discoverability. Key information (like pricing updates) is prominent. Options are clearly grouped, and selected features are easily identifiable, reducing user strain and improving efficiency.

Persistent Session Memory

The configurator intelligently stores the user’s entire configuration and chosen finance option for future sessions. This combats frustration from losing progress, allowing returning users to pick up exactly where they left off, significantly reducing friction.

Anticipated Impact

Quantifying the Gains

Implementing this human-centered redesign is projected to yield significant and measurable business improvements for Nissan, grounded in industry-standard calculation methodologies and a conservative projection model.

Increase in Finance-Plan Completions

Reduction in Finance-Related Support Queries

  • Boosted User Satisfaction & Trust: A more intuitive and transparent experience will foster stronger customer loyalty.
  • Enhanced Brand Perception: Positions Nissan as a customer-centric digital leader.
  • Regained Competitive Edge: Closes the gap with competitors by offering a truly superior online experience.

Thorough analysis of existing system performance included current conversion rates (specifically configurator and finance-plan completions), support ticket volume (quantifying inquiries related to finance/usability), and user frustration/engagement scores (e.g., 1.6/10 engagement, 3.3/10 frustration). Comparative benchmarking against competitor performance (e.g., Mazda’s higher completion rates) also established realistic improvement targets for the redesign.

UX professionals conducted heuristic evaluations on the existing system, identifying violations of usability principles (e.g., lack of progressive disclosure, unclear feedback) and correlating them with user friction. Usability testing with representative user groups exposed specific pain points; their frequency and severity were recorded (e.g., “80% of users struggled to find finance information”), forming a strong basis for anticipated improvement.

Referencing successful redesigns in similar industries (other automotive configurators, complex e-commerce platforms) provided a basis for potential uplift. Reputable industry reports and UX case studies often publish average improvement percentages for specific UX enhancements (e.g., “streamlined checkout processes typically yield a X% increase in conversions”).

Initial moderated usability testing with the Figma prototype was crucial. Observing users interacting with the *new* flow, how quickly they found finance options, and the reduction in questions about terminology provided strong directional data. Task completion rates (e.g., successfully finding a monthly payment for a 3-year PCP) were measured against observed rates in the old system.

The projected figures (e.g., +9% finance-plan completions, -28% support queries) are derived from a conservative model combining baseline data with estimated improvements from qualitative observations and industry benchmarks. This approach attributes a percentage of observed friction to specific UX issues, projecting the corresponding recovery, ensuring compelling yet credible targets.

Who Developed the Projections?

These projected gains are a collaborative effort involving:

UX Researchers & Designers

Product Managers

Data Analysts / Business Intelligence Teams

Marketing Teams

Solution Validation & Next Steps

Prototype Testing: Confirmed clear value and predicted performance gains.

Stakeholder Review: Nissan’s Product Steering Committee reviewed assumptions, baseline data and modelling methodology; they endorsed the forecast as conservative and defensible.

Next Steps Post-Approval

1. Develop a Standalone Finance Module

  • Build the Finance Widget micro-frontend component within Nissan’s existing framework (e.g. React).

  • Instrument front-end events (widget_impression, widget_click, finance_apply) for analytics.

2. Dark-Launch A/B Testing

  • Route 50 % of configurator traffic to V2 while retaining V1 for the other 50 %.

  • Collect 10 000+ configuration sessions over 4–6 weeks to measure actual finance-completion lifts and ticket reductions.

3. Iterate Based on Live Feedback

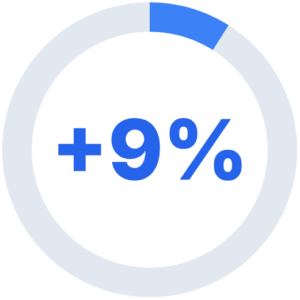
  • If the uplift reaches only 5 % instead of 9 %, investigate widget discoverability on small viewports, session-storage accuracy and micro-copy clarity.

  • Refine until metrics meet or exceed forecasts.

Reflections

  • Maintaining context through a persistent widget proved crucial. Users no longer had to hunt for their finance plan or restart when returning.

  • Early technical audits avoided costly rework by uncovering error-prone scripts before visual design.

  • Conservative forecasting, validated by data, ensured stakeholder confidence. Aligning prototype observations with production analytics created a compelling business case.

  • Small micro-copy tweaks—“Select finance plan” instead of “Choose now”, clearer “Clear saved plan” link—yielded meaningful usability gains.

Conclusion

The Car Configurator V2 redesign exemplifies how targeted UX improvements—guided by rigorous research, prototype validation and conservative forecasting—can address critical pain points and close competitive gaps. By transforming the configurator into a multi-step journey and adding a session-memory finance widget, the team forecasted measurable business impact: a 9 % lift in finance-plan completions, a 28 % reduction in support queries and significantly improved user satisfaction. This case study demonstrates the importance of balancing visionary design with data-driven justification for a robust, stakeholder-approved approach.