
Driving Digital Performance
Nissan Pop-Up Event UX Optimisation
Listen to the Case Study Overview:
Discover how a luxury hotel achieved impenetrable security for a Head of State while ensuring zero disruption for regular guests
.
This brief audio overview unveils the innovative service design strategy that made security truly invisible.
Listen to understand the paradox, the process, and the unparalleled results.
Driving Digital Performance
Nissan Pop-Up Event UX Optimisation
My Role
Senior UX Designer – Lead Consultant
Leveraging Medallia Decibel analytics and UX strategy to drive performance improvements.
Project
Data analysis from August 2024 event informing strategy for January 2025 Pop-Up Event.
Objective
To analyse the performance disparities between two significant online promotional events. The goal was to use insights from an underperforming event to strategically enhance the user experience and conversion efficiency of a subsequent flagship campaign. This case study demonstrates a data-driven approach to continuous UX optimisation, transforming past challenges into future successes.
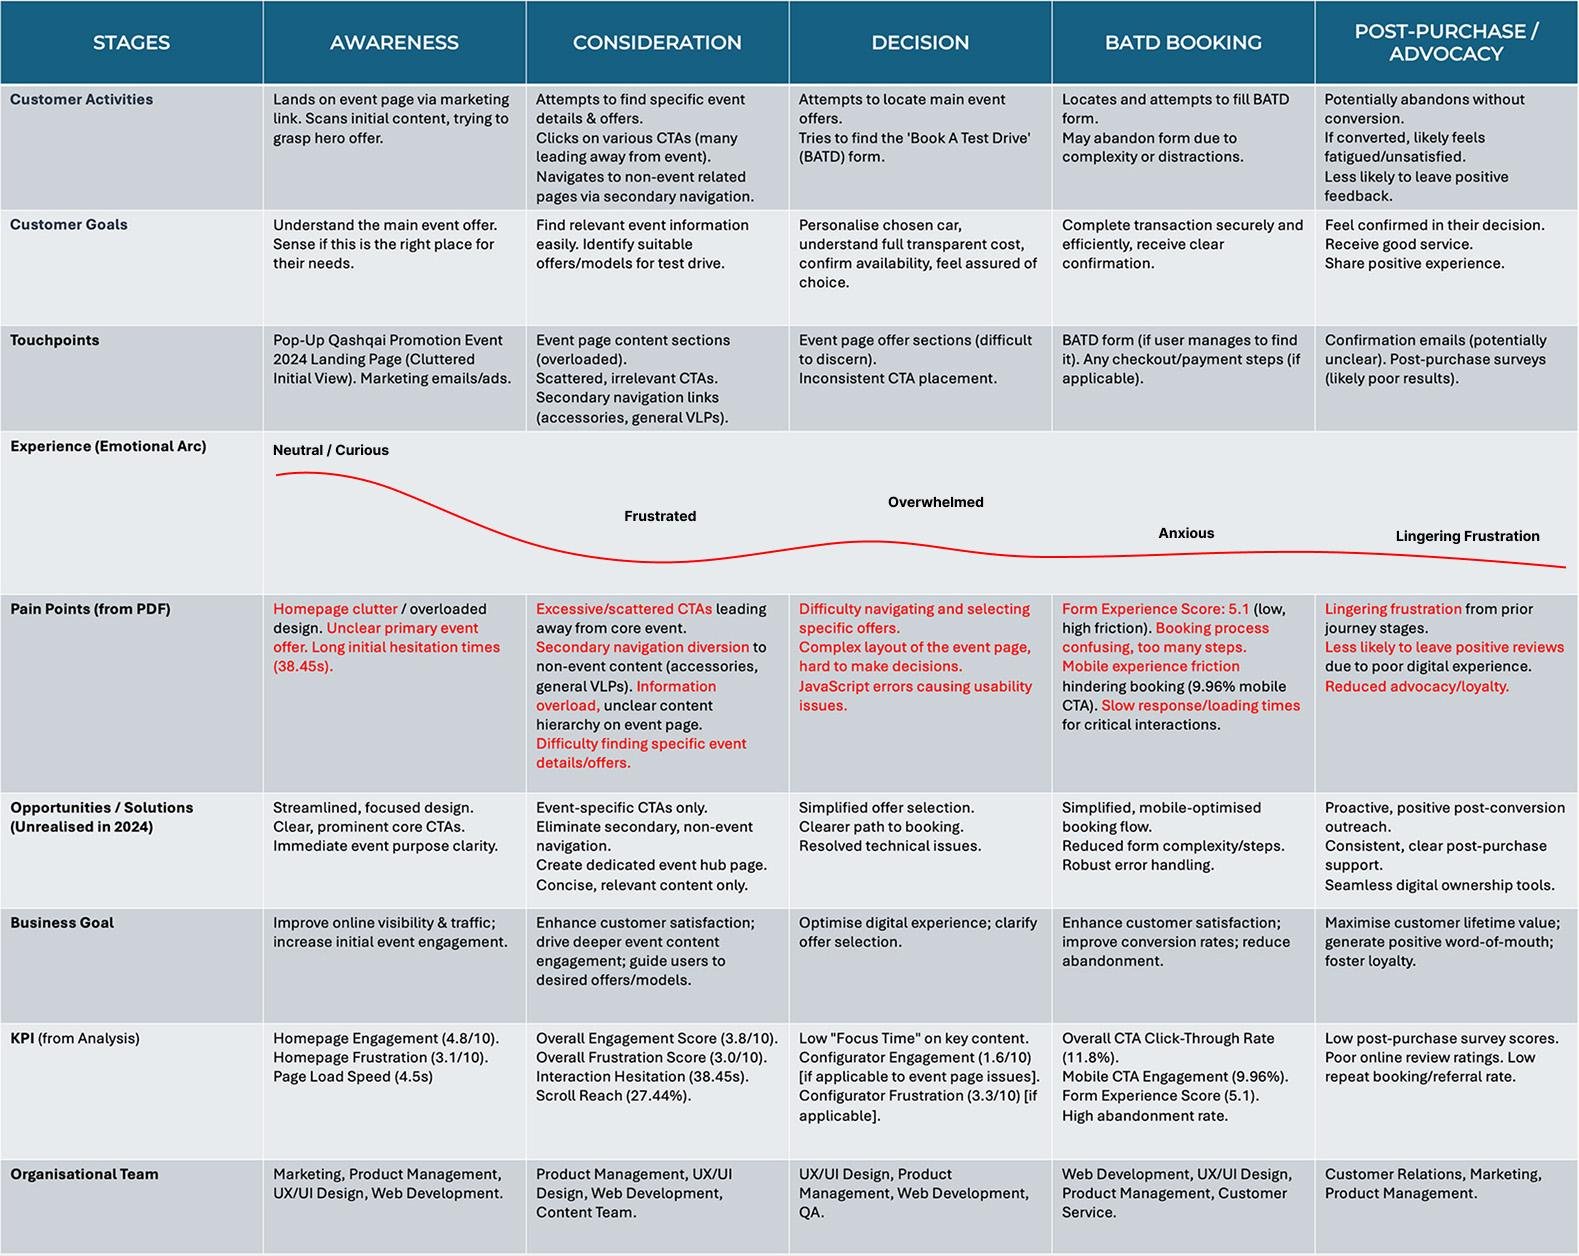
The Challenge
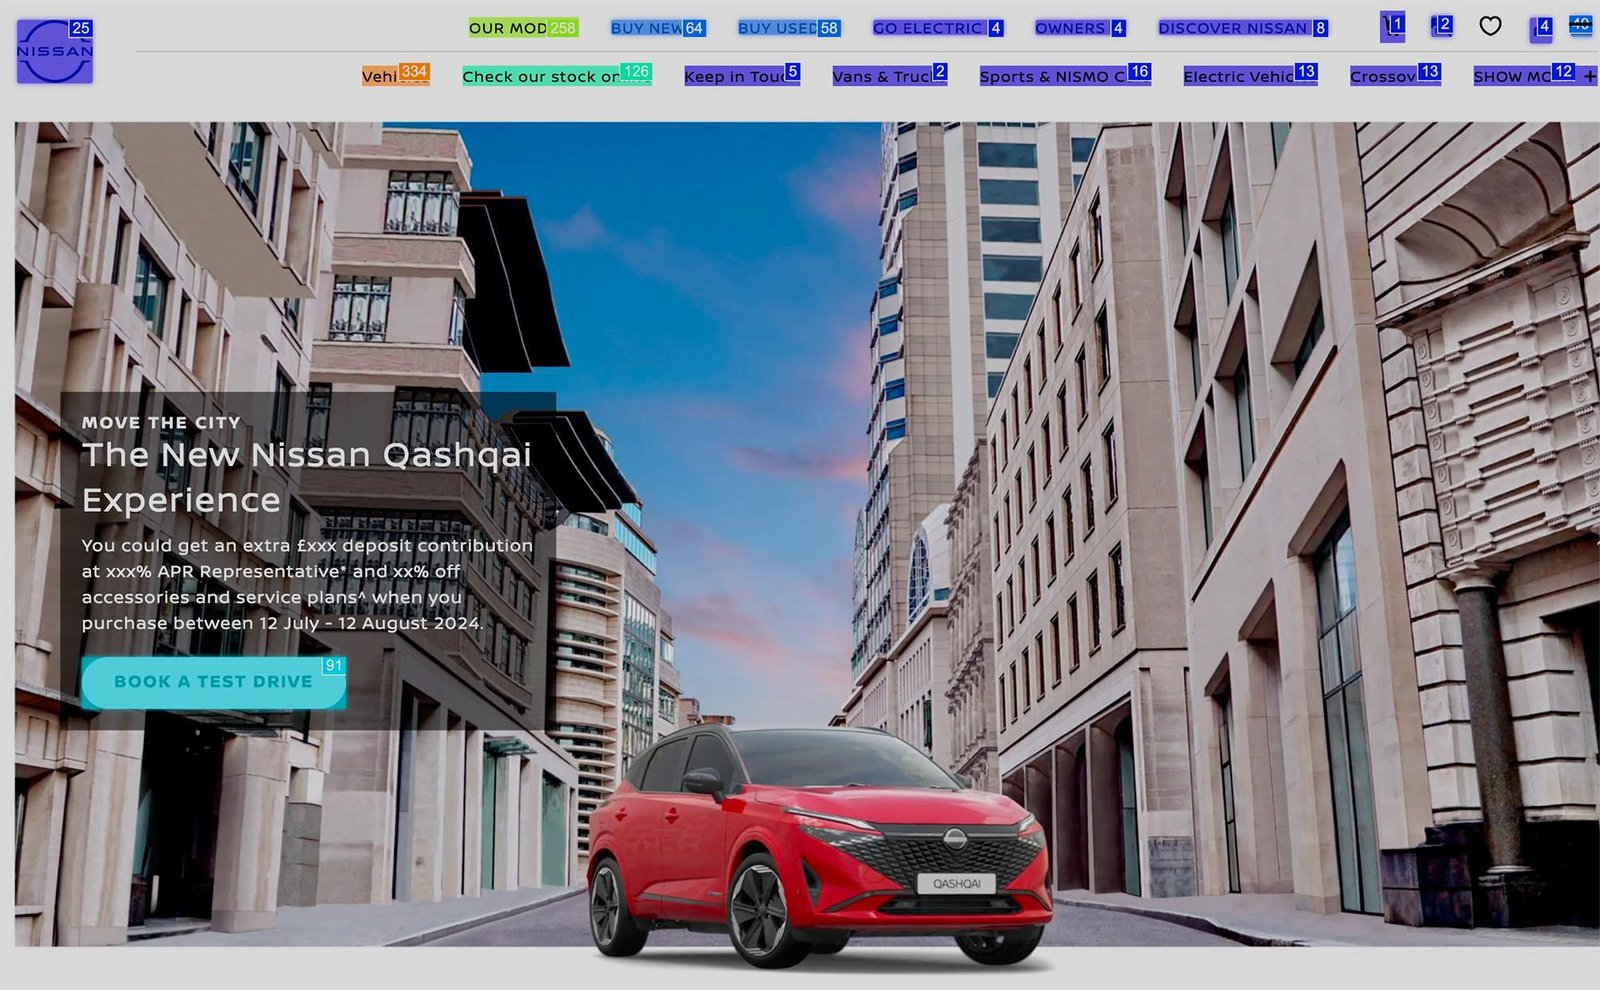
Unpacking Underperformance – The Pop Up Qashqai Promotion Event 2024 (August 2024)
The Nissan Pop Up Qashqai Promotion Event 2024, held in August 2024, showed significant user experience challenges despite high page views. An external advertising agency had designed the event page, packing it with excessive content and numerous Calls-to-Action (CTAs). Many of these CTAs led users away from the core offer details and relevant pages.
The page also included secondary navigation to non-event sections like accessories and the main Vehicle Landing Page. This design caused significant visitor confusion, information overload, and an unclear journey towards the crucial ‘Book A Test Drive’ (BATD) form. My deep dive into the Medallia Decibel data revealed a critical disconnect: high traffic didn’t translate into desired engagement or low frustration.
Empathy Map: 2024 Event
HEAR
- “Where’s the actual offer details?”
- “There are too many buttons here.”
- “Is this for the event or just the main site?”
- “I just want to find a test drive form easily.”
- “This page feels very busy.”
THINK
- “I need to find specific event information quickly.”
- “This navigation is sending me everywhere but what I
- came for.”
- “Am I on the right page for the event?”
- “This is taking too long.”
- “Is there a simpler way to book?”
FEEL
- Confused by excessive options.
- Frustrated by unclear paths.
- Overwhelmed by too much content.
- Disengaged due to lack of focus.
- Hesitant to click on anything.
DO
- Scrolls aimlessly, looking for relevant info.
- Clicks on multiple irrelevant CTAs.
- Navigates to non-event pages.
- Spends more time than intended on the page.
- May abandon the page without completing the goal.
PAIN
- Information overload from too many CTAs and content.
- Unclear user journey due to scattered links and secondary navigation.
- Frustration from difficulty finding core event details.
- Time wasted on irrelevant parts of the site.
- Perception of a disorganised digital experience.
GAIN: Achieved Outcomes
- A clear, concise path to event details and offers.
- Easy access to test drive booking forms.
- A focused page experience without distractions.
- Confidence that they’re on the right track.
- Efficiency in finding what they need.
Key Problems Identified – August 2024
Low Engagement
Engagement Score: 3.8
Users showed limited meaningful interaction with the content
High Frustration
Frustration Score: 3.0
Significant friction, especially due to on-page form.
Ineffective Calls-to-Action
Overall CTA CTR: 11.8%
Scattered, irrelevant CTAs confused users and hindered conversions.
Long Interaction Hesitation
Interaction Hesitation: 38.45s
Users took too long to make their first click, indicating ambiguity.
Limited Content Exploration
Scroll Reach: 27.44%
Visitors didn’t scroll deeply, missing crucial information.
Low Focus Time
Average Interaction Time: 16.55s
Users weren’t actively engaging with key content blocks.
2024 Pop-Up Event Journey Map
My Role & Approach
Data-Driven UX Strategy & Iteration
Empathise & Define
Understanding the ‘Why’
Deep Decibel Analysis
Thoroughly analysed 2024 event data (DXS, engagement, frustration, interaction patterns, device-specific performance).
Identifying Root Causes
Sought to understand *why* users were frustrated/disengaged (e.g., form’s low score, low focus/scroll).
Benchmarking
Compared event performance against overall NMGB site for contextual improvements.
Ideate & Prototype
Strategising for Impact
Conversion Optimisation Insights
Used 2024 learnings to guide users effectively, avoiding past pitfalls.
Refining UX & Content Strategy
- Simplifying user journeys by streamlining forms (addressing score 5.1).
- Enhancing visual hierarchy & CTA placement (large touch targets, prominent cues).
- Explicitly avoided non-event-related CTAs/navigation; created dedicated event hub.
- Optimising content chunks for scannability & engagement.
- Ensuring technical robustness.
Test & Implement
(Real-World Application)
Strategic Adjustments Implemented
Applied refined UX and content (responsive, mobile-first, streamlined) to the 2025 Pop-Up Event page.
Continuous Monitoring
Used Medallia Decibel for real-time validation and persistent focus on device-specific performance for ongoing optimisation.
Impact & Success
Quantifiable Results
The January 2025 Pop-Up Event delivered exceptional results, validating the data-driven UX optimisation strategy.
Engagement Score
Lower Frustration
Overall CTA Click-Through Rate
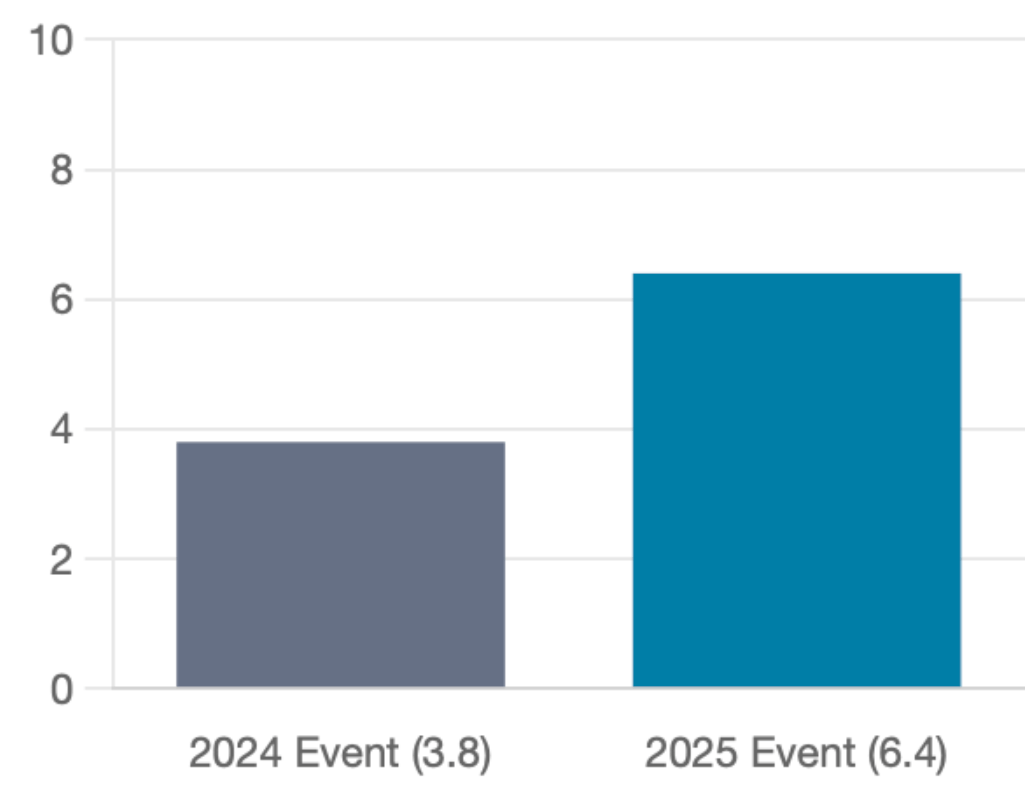
+40.6% Increase (6.4 vs 3.8 in 2024).
Users were more actively engaged with content.
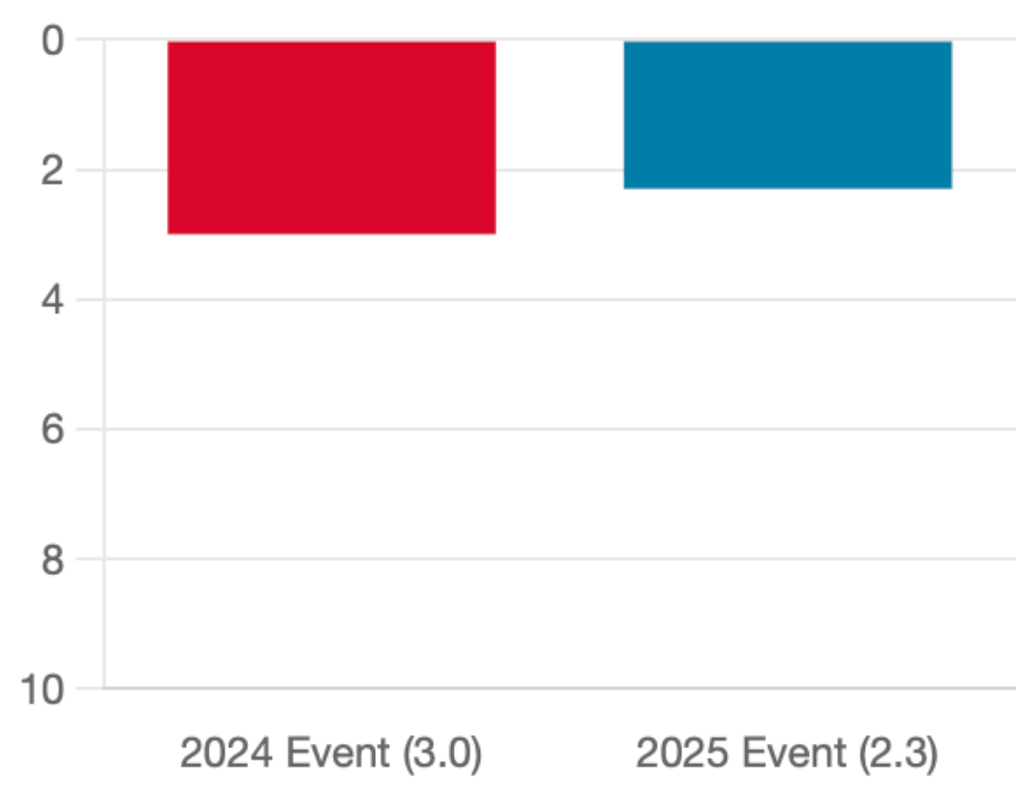
-30.4% Reduction (2.3 vs 3.0 in 2024).
A smoother, more pleasant user experience.
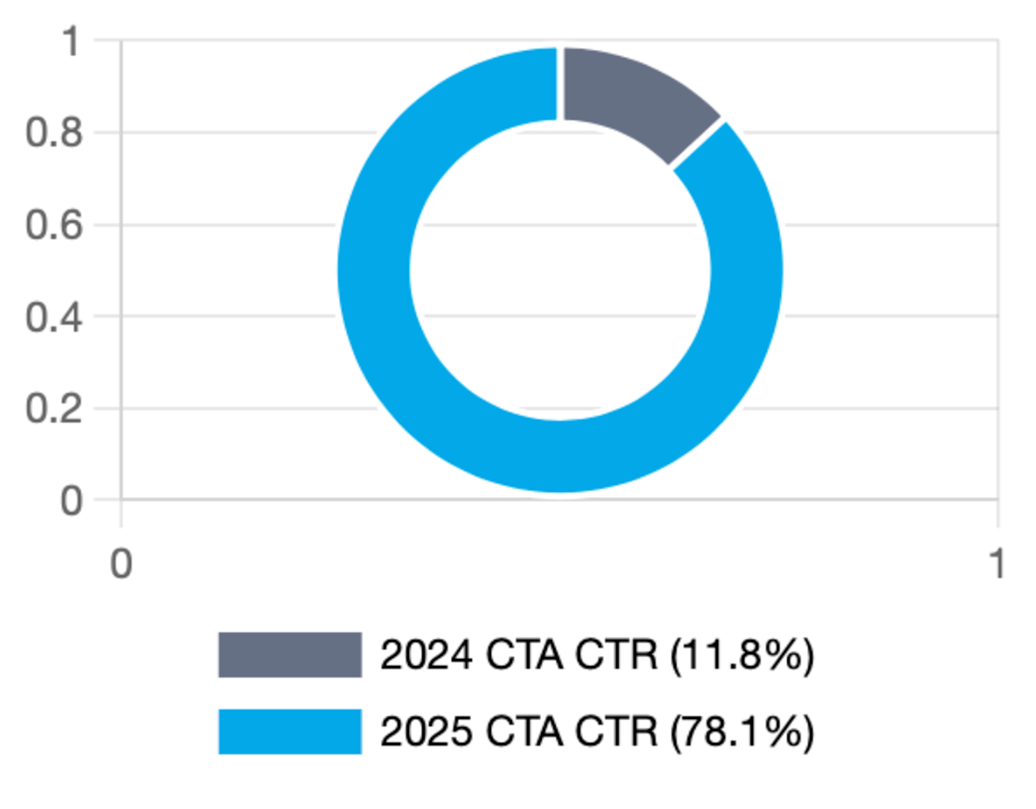
78.1% overall CTA CTR (vs 11.8% in 2024).
Significant gains in conversion efficiency and user guidance.
Mobile Success: CTA Click-Through Rate
The mobile experience excelled, highlighting effective mobile-first design.
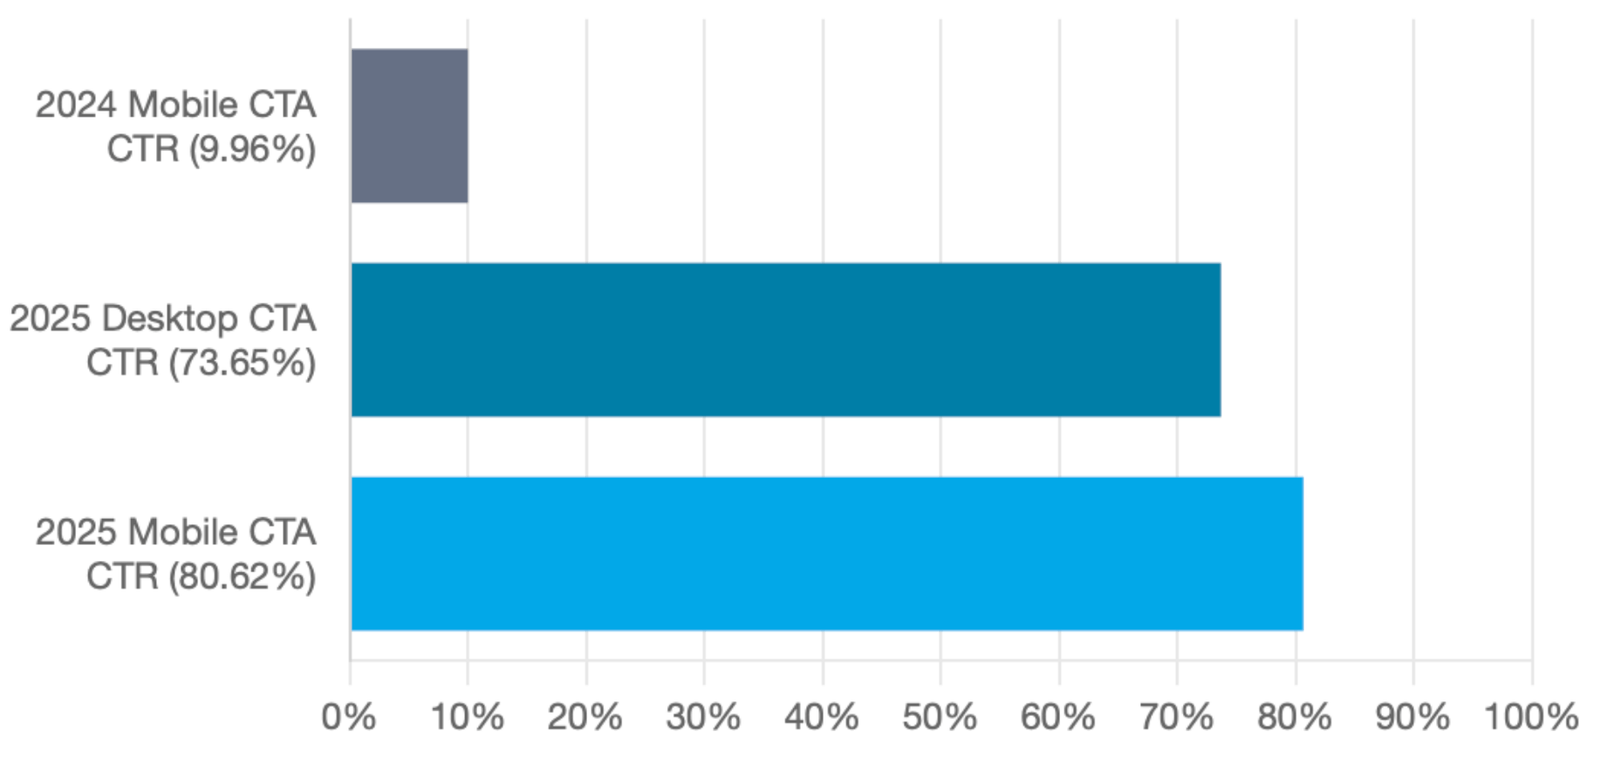
80.62% Mobile CTA CTR (vs 9.96% in 2024)
Outperformed even desktop (73.65%) for the 2025 event.
Site Traffic Rebound & Key Page Boosts
+375,044
Pageviews Increase on NMGB site, breaking 3 periods of decline.
Key Landing Page Performance:
Qashqai Landing Page: Traffic recovery.
X-Trail Landing Page: 125% increase.
Juke Landing Page: 37.4% rise.
Deeper Content Exploration
Users spent more time actively engaged and explored more content on the page.
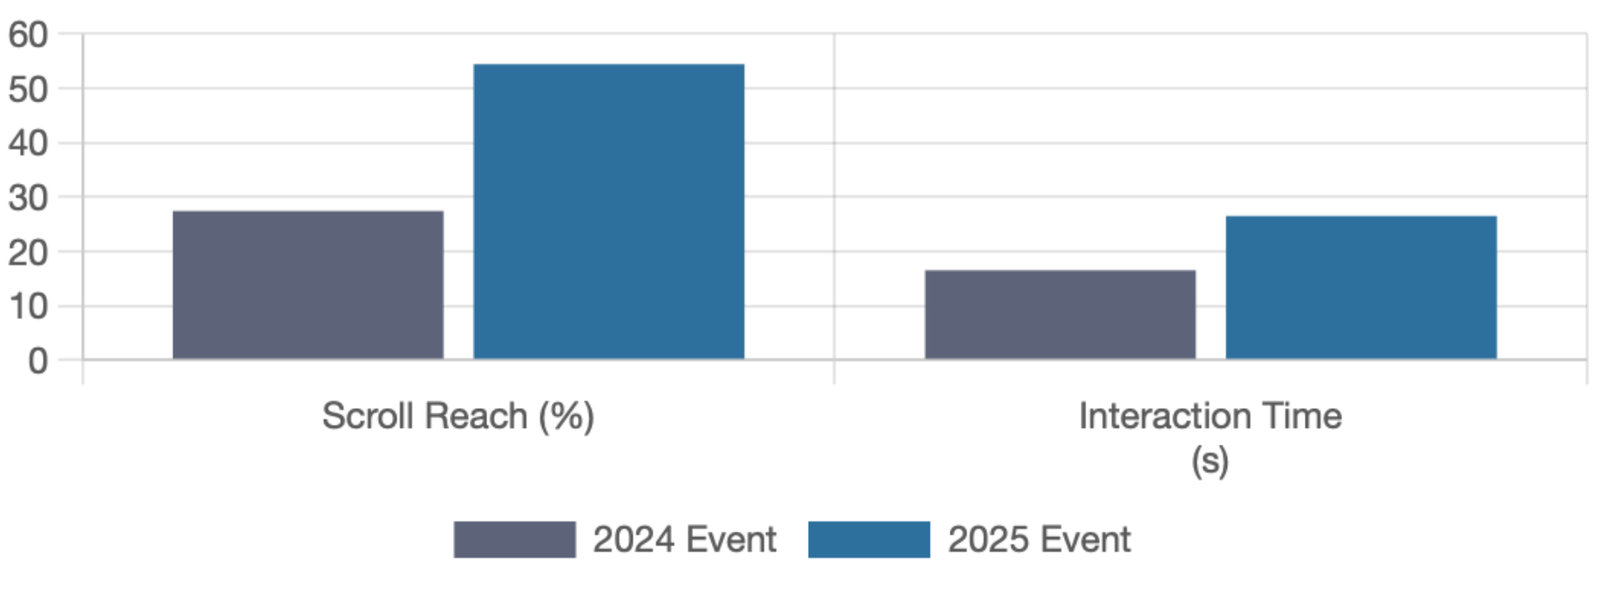
Scroll Reach: 54.44% (vs 27.44% in 2024)
Interaction Time: 26.53s (vs 16.55s in 2024)
The 2025 Pop-Up Event delivered a significantly superior digital experience, effectively engaging users, minimising frustration, and achieving high CTA interaction and smooth navigation, leading to higher conversion efficiency across all devices.
UX Best Practices Implemented & Highlighted
Data-Driven Design
Leveraging Medallia Decibel for data-backed problem diagnosis.
User-Centred Problem Solving
Directly addressing user pain points for intuitive experiences.
Iterative Design & Optimisation
Applying learnings from past events for continuous improvement.
Mobile-First & Responsive Design
Optimising for smaller screens to enhance engagement.
Information Architecture & Visual Hierarchy
Strategic CTA placement and clear content organisation for guided action.
Conversion Optimisation
Streamlining user journeys to efficiently drive key business goals.
Performance Monitoring & Analysis
Continuous use of analytics for real-time insights.
Cross-Functional Collaboration
Effective teamwork with 3rd party creative agencies, content, marketing, and development teams.
Key Takeaways & Future Outlook
Detailed UX analysis from challenging campaigns provides a strong foundation for future success. By pinpointing user friction in the 2024 event, I strategically refined the UX and content for the 2025 Pop-Up Event, focusing on mobile user journey and funnel clarity.
The remarkable rebound in site traffic and significantly higher engagement and CTA efficiency (especially on mobile) underscore the strong impact of proactive, data-informed UX design. Careful analysis and targeted UX improvements not only solved immediate problems but also contributed to broader digital marketing success and user satisfaction. Every user interaction provides valuable data for continuous enhancement.